SUI I Monthly CLS I KL - OB I Model 1 I TP1 50% then openHey, Market Warriors, here is another outlook on this instrument
If you’ve been following me, you already know every setup you see is built around a CLS range, a Key Level, Liquidity and a specific execution model.
If you haven't followed me yet, start now.
My trading system is completely mech
Key data points
No news here
Looks like there's nothing to report right now
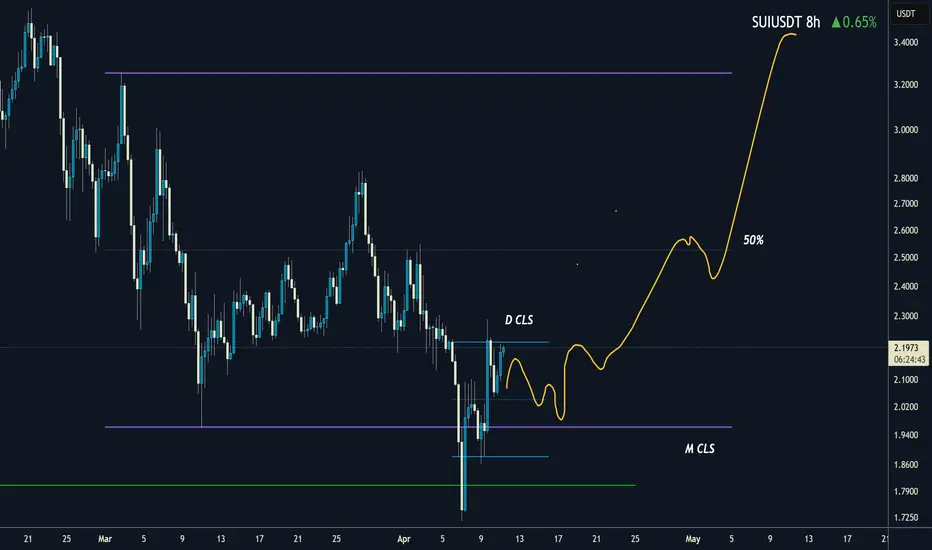
Lingrid | SUIUSDT key Support LEVELS Holding after RetestBINANCE:SUIUSDT market retraced to the support level before rebounding, having taken liquidity from below the psychological level of 2.00. This move was also accompanied by a fake breakout of the previous month's low, indicating a potential reversal in sentiment. On the daily timeframe, price is te


Wyckoff Cycle - Practical Example (SUI)Dear TradingView community and fellow traders,
I am Richard, also known as theSignalyst.
I find the SUI daily chart to be intriguing as it appears to be following the famous Wyckoff Cycle.
I would like to apply Richard Wyckoff's four market stages/phases to this chart for analysis as a practical e

SUI price analysis If we look at the OKX:SUIUSDT chart globally, you'll see that the April drop stopped at a retest of a strong mirror zone.
And even now, when the CRYPTOCAP:BTC price is trying to correct itself, the #SUI price is very well-supported.
Therefore, globally, any purchase of #SUI while the price is

SUI Is Entering Into Final Stage Of Bull MarketHello, Skyrexians!
On yesterday's crypto pump BINANCE:SUIUSDT was the greatest performer and people started to have an interest in this coin will continue growing or this is just a bull trap. Let's try to understand it.
On the 1W time frame we have unclear, but Elliott wave structure. It looks l

**SUI Poised at Crucial Support: Will a Breakout Follow?**SUI is currently perched on a critical support area on the higher timeframes, and all signs point to an impending decisive move. This zone is supported by multiple high-confluence indicators—including the VWAP’s point of control, daily support, and weekly support—making it a high-probability region

SUIUSDT – Liquidity Build-Up or Just a Beautiful Trap?“If you’re long here, you’re not early. You’re just lunch.”
🧠 Institutional Context
Strong POC at $2.06
Price consolidating above the value area, with multiple rejections at $2.18–2.22
Open Interest rising while price stalls → leveraged longs stacking = trap in progress
Delta staying negative →

SUIUSDT | Buyers Are Active but Patience Pays MoreWe're seeing some interest from buyers on SUIUSDT at the current levels, but personally, I wouldn’t rush into a serious position just yet. This kind of price action, especially in this part of the chart, can often be deceptive and cause unnecessary emotional trading.
📌 Wait for the Blue Box
The bl

See all ideas
Summarizing what the indicators are suggesting.
Oscillators
Neutral
SellBuy
Strong sellStrong buy
Strong sellSellNeutralBuyStrong buy
Oscillators
Neutral
SellBuy
Strong sellStrong buy
Strong sellSellNeutralBuyStrong buy
Summary
Neutral
SellBuy
Strong sellStrong buy
Strong sellSellNeutralBuyStrong buy
Summary
Neutral
SellBuy
Strong sellStrong buy
Strong sellSellNeutralBuyStrong buy
Summary
Neutral
SellBuy
Strong sellStrong buy
Strong sellSellNeutralBuyStrong buy
Moving Averages
Neutral
SellBuy
Strong sellStrong buy
Strong sellSellNeutralBuyStrong buy
Moving Averages
Neutral
SellBuy
Strong sellStrong buy
Strong sellSellNeutralBuyStrong buy
Displays a symbol's price movements over previous years to identify recurring trends.
Frequently Asked Questions
The current price of SUI / TetherUS (SUI) is 3.4448 USDT — it has risen 3.02% in the past 24 hours. Try placing this info into the context by checking out what coins are also gaining and losing at the moment and seeing SUI price chart.
SUI / TetherUS price has risen by 44.11% over the last week, its month performance shows a 23.56% increase, and as for the last year, SUI / TetherUS has increased by 174.31%. See more dynamics on SUI price chart.
Keep track of coins' changes with our Crypto Coins Heatmap.
Keep track of coins' changes with our Crypto Coins Heatmap.
SUI / TetherUS (SUI) reached its highest price on Jan 6, 2025 — it amounted to 5.3687 USDT. Find more insights on the SUI price chart.
See the list of crypto gainers and choose what best fits your strategy.
See the list of crypto gainers and choose what best fits your strategy.
SUI / TetherUS (SUI) reached the lowest price of 0.1000 USDT on May 3, 2023. View more SUI / TetherUS dynamics on the price chart.
See the list of crypto losers to find unexpected opportunities.
See the list of crypto losers to find unexpected opportunities.
The safest choice when buying SUI is to go to a well-known crypto exchange. Some of the popular names are Binance, Coinbase, Kraken. But you'll have to find a reliable broker and create an account first. You can trade SUI right from TradingView charts — just choose a broker and connect to your account.
Crypto markets are famous for their volatility, so one should study all the available stats before adding crypto assets to their portfolio. Very often it's technical analysis that comes in handy. We prepared technical ratings for SUI / TetherUS (SUI): today its technical analysis shows the strong buy signal, and according to the 1 week rating SUI shows the buy signal. And you'd better dig deeper and study 1 month rating too — it's strong buy. Find inspiration in SUI / TetherUS trading ideas and keep track of what's moving crypto markets with our crypto news feed.
SUI / TetherUS (SUI) is just as reliable as any other crypto asset — this corner of the world market is highly volatile. Today, for instance, SUI / TetherUS is estimated as 6.15% volatile. The only thing it means is that you must prepare and examine all available information before making a decision. And if you're not sure about SUI / TetherUS, you can find more inspiration in our curated watchlists.
You can discuss SUI / TetherUS (SUI) with other users in our public chats, Minds or in the comments to Ideas.