BITCOIN Say goodbye to low prices if this level breaks. Bitcoin (BTCUSD) has turned sideways the past couple of days following the strong bullish reaction on the 1W MA50 (red trend-line). The reason it that it is about to face the most common Resistance of this Cycle, the 1D MA50 (blue trend-line).
Within the current (2023 - 2025) Bull Cycle, BTC always started its new rally near or on the 1W MA50 but the most important development to confirm that was a break above the 1D MA50. On both previous correction/ accumulation phases, the 1D MA50 break coincided with a 0.618 Fibonacci retracement break.
The bottom of each phase is formed when the 1W MA50 gets tested on a Double Bottom, which we've had on March 11 2025, September 06 2024 and September 11 2023. Among those fractals, their 1D RSI patterns post identical sequences.
As a result, once the price breaks above the 1D MA50, we can claim that the most optimal buy opportunity of the past 6 months will cease to exist and then you'll have to chase a rally all the way to at least a +97% rise (late 2023 rally, the late 2024 was even stronger at +106%). That gives us a minimum target estimate of $150000.
Do you think that would be the case? Break above the 1D MA50 and off to the races with no looking back? Feel free to let us know in the comments section below!
-------------------------------------------------------------------------------
** Please LIKE 👍, FOLLOW ✅, SHARE 🙌 and COMMENT ✍ if you enjoy this idea! Also share your ideas and charts in the comments section below! This is best way to keep it relevant, support us, keep the content here free and allow the idea to reach as many people as possible. **
-------------------------------------------------------------------------------
💸💸💸💸💸💸
👇 👇 👇 👇 👇 👇
Cryptocurrency

SOLUSD: Bottom formation in process. Target 350.Solana just turned neutral on its 1D technical outlook (RSI = 48.726, MACD = -4.803, ADX = 29.746) as it is approaching the 1D MA50 following a strong rebound on both the S1 Zone but more importantly the 1W MA100. Straight after the low, the market formed a 1D Death Cross. The previous such pattern (September 6th 2024) was formed again on a market low on the S1 Zone. Whether the rebound takes effect immediately or 2 months (max) after, we see this as a great buy opportunity to aim at the HH Zone and the 2.618 Fibonacci extension (TP = 350.00).
## If you like our free content follow our profile to get more daily ideas. ##
## Comments and likes are greatly appreciated. ##

BITCOIN Mega Cycle starting the final Parabolic Rally.This is not the first time we review the Mega Cycle Theory on Bitcoin (BTCUSD). This states that in reality BTC's Cycle's since the beginning aren't 4 as traditional models suggest but 2. And in fact instead of the 4th, we are currently on just the 2nd BTC Mega Cycle.
Well this Theory has for sure a better gel with the stock market trend in the past 15 years but what's more important is that the price is now (March 2025) within the underlying Pivot trend-line and the 1W MA50 (blue trend-line), which is the same level it was coming toward the end of the 1st Mega Cycle. That was when it broke above the Pivot and started the hyper aggressive Parabolic Rally.
This Pivot trend-line is essentially the level that starts after the initial Cycle rally and acts as a Resistance turned Support and then Resistance again until the Cycle's final Parabolic Rally. Practically the Cycle mapping is more effectively viewed on the 1W RSI sequence. We are now at the stage when the 1W RSI ranges for the past 2 years between overbought (80.00) and neutral (45.00) like it was in 2016 - 2017.
In any case, this is yet another study showing that Bitcoin's Top can be at around $150k, which is currently marginally above the Pivot and as we head towards the end of 2025, the bar is raised to as high as $200.
So do you think we are just starting the final year Parabolic Rally to at least $150k? Feel free to let us know in the comments section below!
-------------------------------------------------------------------------------
** Please LIKE 👍, FOLLOW ✅, SHARE 🙌 and COMMENT ✍ if you enjoy this idea! Also share your ideas and charts in the comments section below! This is best way to keep it relevant, support us, keep the content here free and allow the idea to reach as many people as possible. **
-------------------------------------------------------------------------------
💸💸💸💸💸💸
👇 👇 👇 👇 👇 👇

What BTC is showing?! Full Scenario As of now market is really slow... Why?
As the History of BTC shows that market never formed a new high with out retesting its Support or previous Resistance level, as in 2020 market break its Resistance level which was 19,000 and market formed a new high in 2021 which was 68,000 after that market didn't formed a new high until it retested its last support level 19,000. After retesting 19,000 market shows us a new high of 109,000 and since Market has formed a new high it didn't retested its Support level which is 68,000, so According to me history will be repeated here, till market don't retest its previous level which is 68,000 market will be slow and bearish. After that market will perform a new high.
According to RSI there is also a bearish divergences which support my vision.

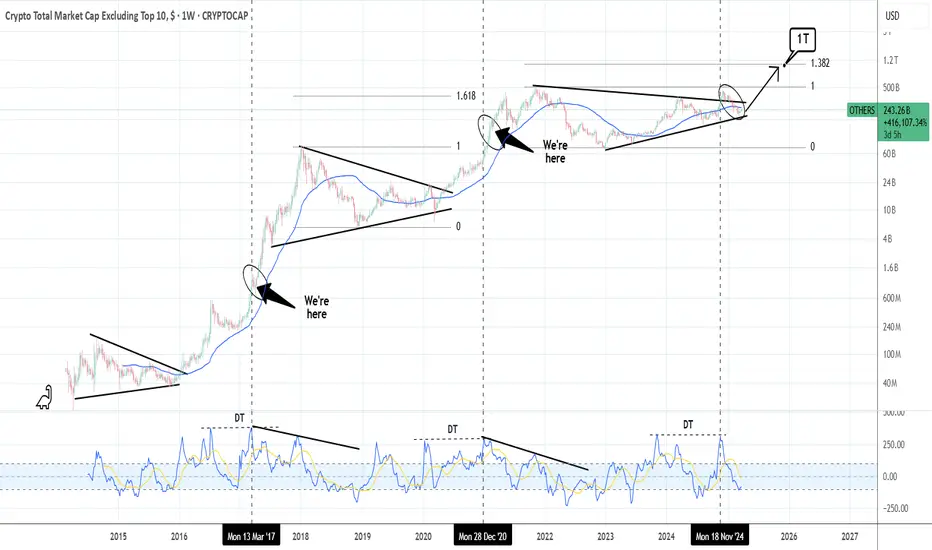
ALTSEASON: Is it really just around the corner?The Crypto Total Market Cap (excluding the Top 10) seems to agree. And it's simply because the price has already broken past the Cycle's Triangle and despite the correction, remains supported on the HL bottom trendline. According to the 1W CCI we are currently well in line with the previous two Cycles and even though the market is unlikely to reproduce the strong returns of especially the first Cycle, it does suggest that there is one last (All Time) High left. A mere 1.382 Fibonacci extension test, will give us the much sought 1 Trillion USD target.
## If you like our free content follow our profile to get more daily ideas. ##
## Comments and likes are greatly appreciated. ##
BTCUSD: What if it's just a Channel Up to $175k?Bitcoin remains neutral on its 1D technical outlook (RSI = 51.175, MACD = -714.800, ADX = 31.665) as it is stuck between the 1D MA50 and 1D MA200 but it's the wider timeframes that are particularly critical right now and more specifically the 1W, which is causing the current rebound on the 1W MA50. We can argue that the pattern since the Dec 2017 Top is a Channel Up, even though the last Bear Cycle bottom didn't make exact contact with its bottom.
We can equally however assume that the new Cycle High won't make direct contact with the Channel's Top either. And that's also backed up technically by the Fibonacci levels of the previous Cycle, which saw BTC making a Top just over the 1.618 Fib extension. Consequently we can assume the new Top to hit at least $175,000 (Fib 1.618 currently). The bullish wave is also a direct Channel Up since the November 2022 bottom after all. Even on the previous Cycle, if we exclude the COVID crash price distortion, the bullish wave was a Channel Up as well.
## If you like our free content follow our profile to get more daily ideas. ##
## Comments and likes are greatly appreciated. ##

90-91K Short setup updateMorning folks,
So, today we need just 1H chart as not many events happened. In a recent two weeks people start making upside revisions on BTC price, based on recent JPow comments on QT contraction.
We agree that it has some reasons and supportive to BTC, but they forget that GDP forecast was cut, while inflation increased, which points on stagflation signs.
This is the reason why we do not want to overestimate the positive effect of QT contraction. We still think that BTC could show the pullback to ~70K area.
Now we have three different patterns that point on this level. Since our last update we've got the flag consolidation, that suggests upside continuation. AB-CD based pattern also point on 90-91K area.
So, we still keep our idea to consider shorts around 90-91K area

BITCOIN new All Time High is a certainty.Bitcoin / BTCUSD found excellent support on the 1week MA50 and is staging a full force recovery.
According to the Time Cycles, it sits between the 0.786 and 1.0 Fibonacci levels. That's hostorically the Final Year of the Cycle.
All Fib stages have been fairly similar among those Cycles so if it continues to be that consistent, we should expect the price to rise now non-stop towards the end of the year and price a new All Time High.
Follow us, like the idea and leave a comment below!!

ETHEREUM Is $14000 even possible??Short answer? Yes it is.
Ethereum / ETHUSD is trading inside a 7 year Channel Up and lately has found itself under the 0.618 Fibonacci retracement level for the first time since November 2020.
This is technically a temporary overreaction like the bullish breakout over the 0.382 Fib in March 2024.
Based on the final year rallies inside this Channel Up, we can clearly see that, though very optimistic, $14000 is within reach and won't even be at the top of the Channel Up.
Follow us, like the idea and leave a comment below!!

DOGEUSD: This is the rally that will deliver $1.00Doge is neutral on its 1D technical outlook (RSI = 52.126, MACD = -0.009, ADX = 40.011), recovering from its prior oversold state and testing the 1W MA50 for the first time in 3 weeks. The current rebound is being made after touching the 1W MA200, which is technically the new long term bottom, similar with August 5th 2024 and October 9th 2023. As shown, this is a once in a year buy opportunity that aims for the 1.618 Fibonacci extension on the HH trendline. The trade is long, TP = 1.000.
## If you like our free content follow our profile to get more daily ideas. ##
## Comments and likes are greatly appreciated. ##

BTCUSD: Can $160k be a very 'pessimistic' target estimate?Bitcoin is neutral on its 1W technical outlook (RSI = 50.359, MACD = 2868.500, ADX = 51.194) and having rebounded almost on its 1W MA50, there couldn't be a better buy opportunity for the rest of the year. Basically the price is now ranged inside the 1W MA50 and top trendline of the Pi Cycle, while the 1W CCI hit the -100.00 oversold limit. This has been the most efficient buy entry in August 2024 August 2023 even on the Cycle before in June 2021.
Even if the market doesn't make an 'excessive top' above the Channel Up, like the last two Cycles, hitting $160,000 would still be under the top of the Channel Up and the top of the Pi Cycle. No matter how high this target seems now, it will still be a pessimistic, 'bad case' scenario.
## If you like our free content follow our profile to get more daily ideas. ##
## Comments and likes are greatly appreciated. ##

BITCOIN on a Bull Flag that targets $94000.Bitcoin is trading inside a Channel Up since the March 11th market bottom.
The recent 2day pull back is a Bull Flag that just hit the 0.5 Fibonacci retracement level.
Ahead of an emerging Golden Cross (4h), this is a triple buy signal.
Trading Plan:
1. Buy on the current market price.
Targets:
1. 94000 (the 2.0 Fibonacci extension).
Tips:
1. The RSI (4h) is also rebounding on its 2 week Rising Support. An additional strong buy signal.
Please like, follow and comment!!

XRP ANALYSIS🔮#XRP Analysis 💰💰
#XRP is trading in a symmetrical triangle in a weekly time frame and if it breakouts with high volume then we can see a bullish momentum in #XRP. Before that we will see little bit bearish movement towards its support zone and that a bullish movement.
🔖 Current Price: $2.3520
⏳ Target Price: $2.9740
⁉️ What to do?
- We can trade according to the chart and make some profits in #XRP. Keep your eyes on the chart, observe trading volume and stay accustom to market moves.💲💲
🏷Remember, the crypto market is dynamic in nature and changes rapidly, so always use stop loss and take proper knowledge before investments.
#XRP #Cryptocurrency #Pump #DYOR

The chance that could bring the price of ATOM to $5.If ATOM rises and breaks through the resistance line, it could reach a price of $5 or higher. However, if it touches the line and starts moving downward, its price will drop, potentially reaching as low as $4.5 . BINANCE:ATOMUSDT

SUI ANALYSIS🚀#SUI Analysis :
🔮As we can see in the chart of #SUI that there is a formation of "Falling Wedge Pattern". In a daily timeframe #SUI broke out the pattern. Expecting a bullish move in few days if #SUI retest the levels
⚡️What to do ?
👀Keep an eye on #SUI price action. We can trade according to the chart and make some profits⚡️⚡️
#SUI #Cryptocurrency #TechnicalAnalysis #DYOR

HYPEUSDT Weekly Outlook: Potential Reversal and Upside TargetsWeekly Chart Analysis of HYPEUSDT
The weekly chart of HYPEUSDT reflects a critical phase where the price is consolidating within a key demand zone, suggesting potential for a bullish reversal. Below is the detailed analysis:
Key Observations:
Demand Zone: The price is currently hovering around the highlighted gray box, which represents a strong liquidity zone ( LQ ) between $12.426 and $14.246 . This area has historically acted as support, and a bounce from here could signal a reversal.
Support Levels:
Immediate support lies at $12.426 .
A deeper correction could test the $11.997 and $10.000 levels, which are marked as liquidity levels below the current zone.
Bullish Scenario:
If the price holds above the current demand zone, it could initiate a rounded bottom pattern (illustrated by the yellow curved line).
The first target ( TP1 ) for this potential upside move is $26.825 .
The second target ( TP2 ), representing a more extended rally, is projected at $42.252 .
Candlestick Structure: Recent weekly candles show indecision, but if buyers step in strongly, it could confirm bullish momentum.
Risk Management:
Traders should monitor for any breakdown below the $12.426 level, as it may invalidate the bullish setup and lead to further downside toward $10.000 .
Conclusion:
HYPEUSDT shows promising signs of recovery from its demand zone, with upside targets at $26.825 and $42.252 in sight if bullish momentum builds. However, caution is advised until clear confirmation of reversal occurs.
This analysis provides a roadmap for both short-term and long-term traders to plan their entries and exits effectively.

S&P500 This is the buy opportunity of the year for a 7000 TargetThe S&P500 index (SPX) is in the process of posting its 2nd straight green 1W candle, following a streak of 4 red weeks since the February 17 peak. That streaκ was technically the Bearish Leg of the 1.5-year Channel Up and as you can see, it made a direct contact with its bottom (Higher Lows trend-line).
As the same time, the 1W RSI almost touched the 40.00 Support that priced the October 23 2023 Low, which was the previous Higher Low of the Channel Up. The similarities don't stop there as both Bearish Legs had approximately a -10.97% decline, the strongest within that time-frame.
The Bullish Leg that followed that bottom initially peaked on a +28.85% rise, almost touching the 2.236 Fibonacci extension. Assuming the symmetry holds between the Bullish Legs as well, we can be expecting the index to start the new Bullish Leg now and target 7000 by the end of the year, which is marginally below both the 2.236 Fib ext and a potential +28.85% rise.
This may indeed be the best buy opportunity for 2025.
-------------------------------------------------------------------------------
** Please LIKE 👍, FOLLOW ✅, SHARE 🙌 and COMMENT ✍ if you enjoy this idea! Also share your ideas and charts in the comments section below! This is best way to keep it relevant, support us, keep the content here free and allow the idea to reach as many people as possible. **
-------------------------------------------------------------------------------
Disclosure: I am part of Trade Nation's Influencer program and receive a monthly fee for using their TradingView charts in my analysis.
💸💸💸💸💸💸
👇 👇 👇 👇 👇 👇

BITCOIN historically sees huge rally when Gold peaks. This time?Bitcoin (BTCUSD) is coming, slowly but surely, out of a consolidation following the test and hold of its 1W MA50 and one of the reasons it is about to rally strongly may be flying under the radar for the majority.
That reason has to do with Gold (XAUUSD) and its long-term Cycles. As you can see on this 1W chart, every time Gold peaked in the past 10 years, BTC started the parabolic rally of its Bull Cycle. Equally during Gold's past 2 Cycles, when it revisited that peak and tested that Resistance, it made a Double Top and declined again, which for Bitcoin was translated into a Bear Cycle confirmation.
With the help of the Sine Waves, we can be expecting that Gold Double Top in early April 2026, which means that by that time BTC will already be in its new Bear Cycle. As a result, it is suggested be already out of the market with our profits by the end of 2025.
So based on all that, if Gold makes its Cycle Top now, which is highly likely, Bitcoin will start a parabolic rally. Now, will it be the strongest of its Bull Cycle as the past Cycles suggested? Could be, but even if its not, it should be enough to replicate the late 2024 one and give one final opportunity for profit making.
But what do you think? Is Gold's potential peak here give a very favorable rally to Bitcoin? Feel free to let us know in the comments section below!
-------------------------------------------------------------------------------
** Please LIKE 👍, FOLLOW ✅, SHARE 🙌 and COMMENT ✍ if you enjoy this idea! Also share your ideas and charts in the comments section below! This is best way to keep it relevant, support us, keep the content here free and allow the idea to reach as many people as possible. **
-------------------------------------------------------------------------------
💸💸💸💸💸💸
👇 👇 👇 👇 👇 👇

DOGEUSD making a huge bullish break-out. Eyes 0.800.Dogecoin (DOGEUSD) broke today above the Lower Highs trend-line that started 2 months ago (on the January 18 High).
The natural Resistance remains of course technically the 1D MA50 (blue trend-line) but with the 1D RSI already trending upwards and the price rebounding from the recent low at the bottom of the 1-year Channel Up, we can already claim that the new Bullish Leg has already started.
If it makes just a simple repeat of the previous Bullish Leg (which during Bull Cycles every rally is generally more aggressive than the previous), it can top the Channel Up and make a Higher High at $0.800.
-------------------------------------------------------------------------------
** Please LIKE 👍, FOLLOW ✅, SHARE 🙌 and COMMENT ✍ if you enjoy this idea! Also share your ideas and charts in the comments section below! This is best way to keep it relevant, support us, keep the content here free and allow the idea to reach as many people as possible. **
-------------------------------------------------------------------------------
💸💸💸💸💸💸
👇 👇 👇 👇 👇 👇

KAVAUSD – Midpoint Retest with a Shot at a Daily Higher LowCOINBASE:KAVAUSD / COINBASE:KAVAUSDC
Watching KAVA here on the daily, and it’s at a key decision point that could define the next leg. We’ve got two sets of Fibonacci retracements drawn: the first from the March 2024 high to the August 2024 low, and the second from the August low to the December high. Right now, price is retesting the 50% level of the larger March–August move—aka the midpoint of the macro range—and it's still holding above the 50% retracement of the more recent August–December leg. We’re also sitting right on the 38.2% Fib of that second move, which tends to act as a key area for potential higher lows.
The idea here is simple: I’m playing for a daily higher low. We had a strong move off the December lows, followed by a healthy consolidation, and this is where bulls need to step in. Structure-wise, this is the ideal area for bulls to attempt a defense if the trend is going to continue. EMAs are curling up, and price is still holding above the 12 and 26 EMAs for now, which gives me confidence in a potential bounce.
If the Trade Goes as Planned (Bullish Case)
If buyers step in here and confirm a higher low—ideally somewhere between $0.48 and $0.50—we’d expect a continuation toward the recent high at $0.56. If that level breaks, then $0.64 becomes the next area of interest based on prior price structure and confluence with the upper Fib retracement levels. From there, we could even make a push toward the $0.74 area, where the last major rejection happened in late 2024.
A strong bounce here also sets up a potential inverse head and shoulders structure on the daily if we revisit that neckline around $0.56 again with momentum. In short, a higher low here gives the bulls the setup they need to retake trend control.
If the Trade Fails (Bearish Case)
If price fails to hold the $0.48–$0.50 region and breaks below the August–December 50% Fib level, then we’re likely heading back to the $0.44 zone. That’s where the 200-day SMA is sitting, and it’s also a major pivot from previous support. A loss of that zone opens the door to a full retrace toward $0.39 or even $0.37—last seen during the November-December basing structure.
In that case, the trend would flip neutral at best and would require a fresh base-building phase before bulls could even think about regaining momentum.
TL;DR
Thesis: Playing for a daily higher low above key Fib levels and EMAs.
Bullish Target: Reclaim $0.56 → push toward $0.64–$0.74 if momentum follows through.
Bearish Invalidator: Break below $0.48 = likely revisit of $0.44 or lower.
Not financial advice. Just sharing my thinking as I try to stack confluence and play the levels. Let’s see if this bounce gets legs.

IP – Coiled Triangle with a $10 STORY to Tell?COINBASE:IPUSD / COINBASE:IPUSDC
We’ve got a clean symmetrical triangle forming post-initial listing volatility, and price is nearing the apex. Volume’s dropping off, just like you'd expect in the final stages of compression—classic pre-breakout behavior.
What caught my eye here is how this triangle lines up with a Fibonacci extension target up near $10. Yeah, sounds bold, but zoom out on a log chart and it actually looks pretty reasonable. The measured move from the initial impulse, paired with the triangle breakout structure, gives a clear path to that 1.618 extension level. Throw in the fact that the volume profile starts thinning out above $6, and there’s potential for a swift move if it catches a bid.
Triangle Compression and Breakout Setup
We’re in the late innings of this triangle consolidation. Lower highs, higher lows, volume fading—textbook stuff. If price can get through the $6 zone with conviction, the structure says we could see an aggressive breakout. If not, we’re probably looking at one more fakeout or shakeout before direction resolves.
Fibonacci Extension and Log Chart Math
Using Fib extensions on a log scale paints a pretty compelling picture. $10 sits right at the 161.8% extension off the initial run, and log charts smooth out the scale enough to show how that level isn’t just hopium—it’s structured speculation. The triangle adds context: this isn’t about chasing highs, it’s about waiting for the breakout confirmation from a pattern that’s been compressing for weeks.
Volume Profile and Context
VPVR shows strong acceptance around $5 and fading resistance above. If bulls can flip that region into support, the path to higher prices opens up fast. A breakout from this triangle above $6.25 or so, ideally on volume, could be the signal that this thing is ready to move.
Curious if anyone else is watching this chart. We’ve got a clear triangle, confluence with Fib levels, and log-scale structure supporting a much higher target. Could be a breakout worth watching—or just another consolidation that needs more time to cook.
Not financial advice. Just tracking setups, patterns, and potential. Let’s see if the STORY plays out.

24/03/25 Weekly outlookLast weeks high: $87,453.65
Last weeks low: $81,140.91
Midpoint: $84,297.28
Great weekly close for the bulls! A reclaim of the weekly high in the dying hours of the week is a huge win and has spurred on an early run for the weekly high.
The overall goal for this move should be $91,000 in my opinion, and a must not lose area is $86,000 or 0.75 line/ last weeks weekly high.
What happens at $91,000 is yet to be determined and I have an idea many will be tentative around that area. On the high time frames a reclaim of this level unlocks the capability to retest the highs from a TA standpoint as price re-enters the range bound environment. A rejection of that level would make a $73,000 retest a very real possibility.
In terms of altcoins we're seeing some strength returning with some strong gains but relative to their sell-offs it is a a drop in the ocean so far. Currently the market conditions are a traders dream but a long term investor/holders nightmare. No major news is planned to come this week so unless something drastic happens TA should be the driving factor this week.

BITCOIN just broke above 4H MA200 for the 1st time in 1.5 month!Bitcoin (BTCUSD) broke today above its 4H MA200 (orange trend-line) for the first time in more than 1.5 month (since February 04). This is on its own a major bullish signal but fortunately for buyers, it is not the only one.
Just yesterday, the price also broke above the February 21 Lower Highs trend-line, the first medium-term Resistance of the market that basically started the brutal sell-off of late February and breaking above it technically restores the bullish sentiment back to the market and at the same time formed a 4H MA50/100 Bullish Cross for the first time in more than 2 months (January 18).
Obviously the complete confirmation will come if BTC breaks above its Channel Down but given the fact that 2 Resistance levels already broke and that the bottom looks like a W-shaped recovery pattern, we can already set a Target on the 99500 Resistance, which just so happens to be marginally below the 2.0 Fibonacci extension.
But what do you think? Is this 4H MA200 break-out the bullish signal the market needed after such a long time? Feel free to let us know in the comments section below!
-------------------------------------------------------------------------------
** Please LIKE 👍, FOLLOW ✅, SHARE 🙌 and COMMENT ✍ if you enjoy this idea! Also share your ideas and charts in the comments section below! This is best way to keep it relevant, support us, keep the content here free and allow the idea to reach as many people as possible. **
-------------------------------------------------------------------------------
💸💸💸💸💸💸
👇 👇 👇 👇 👇 👇

SHORT BTC!?According to me market might retest its resistance level 92,000-93,000 then market will complete it's double top pattern, which will endup on retesting its Support level 68,000 after that market may show a NEW HIGH.
