Proof-of-Work Cryptocurrency Mining: Environmental BOMB, Not Balm, for the Planet
Overview
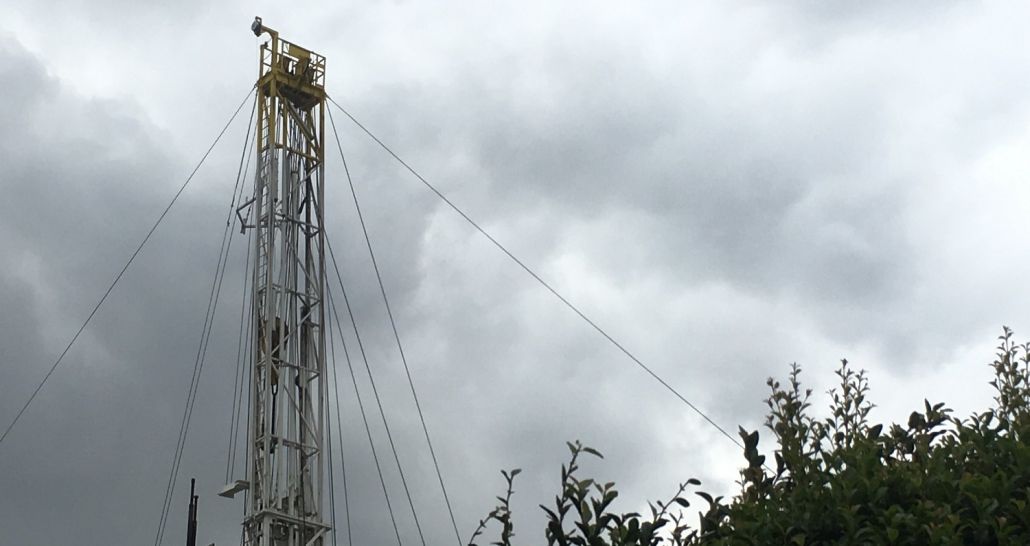
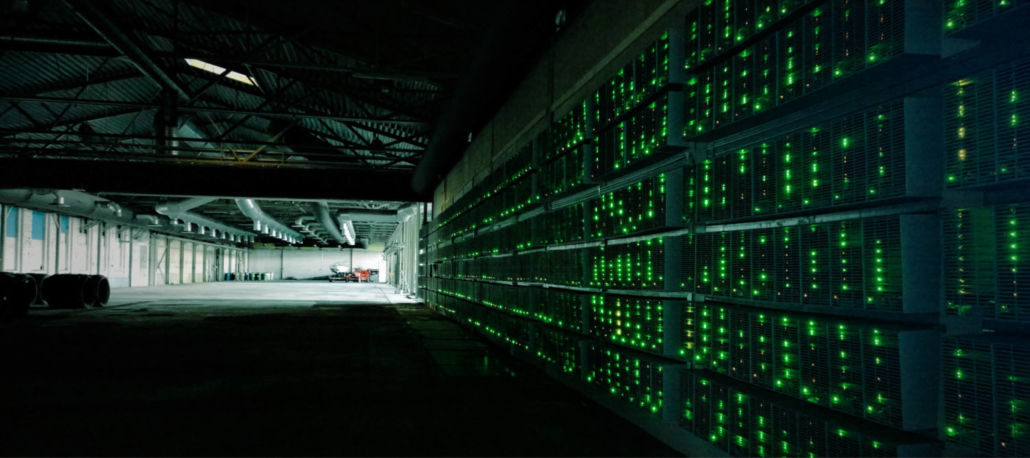
Initially, cryptocurrency was touted as an alluring means of democratizing access to wealth. However, companies that utilize “proof-of-work” mechanisms behind “winning” a Bitcoin require massive amounts of electricity to run calculations on the hundreds of thousands of computers that churn away 24/7, most often drawing electricity from the grid. The emissions from carbon-based fuel that generate electricity are a primary driver of the climate crisis.
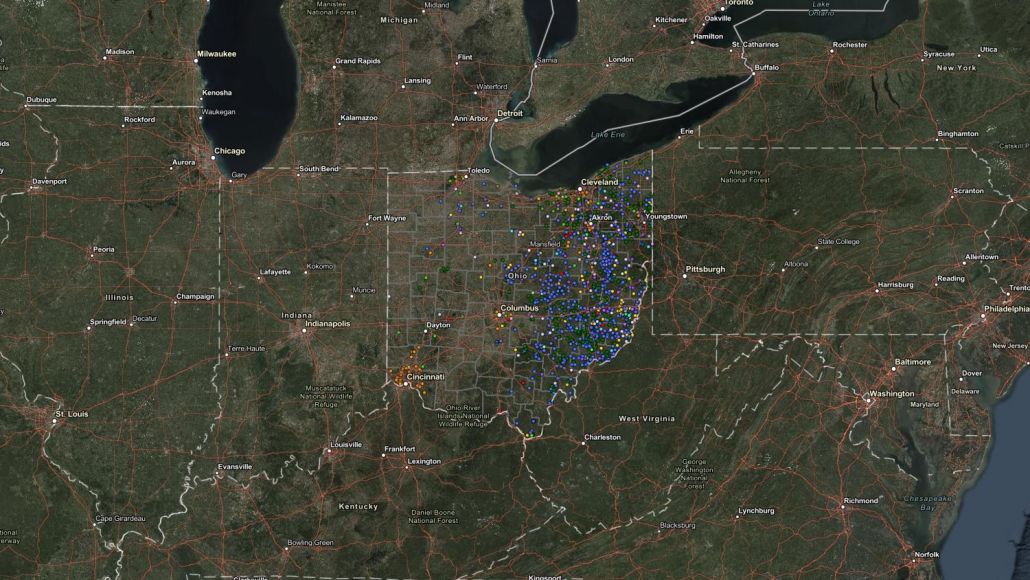
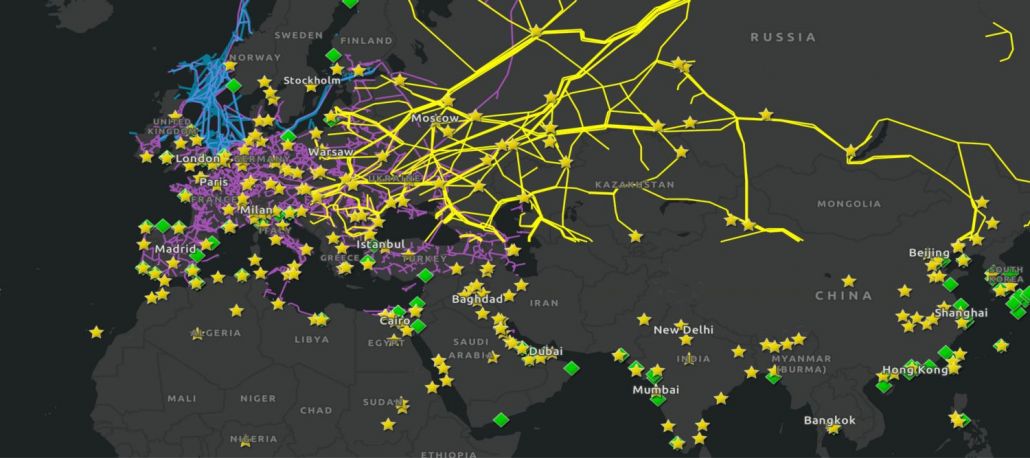
Since late 2021, FracTracker has been collecting information on cryptomining operations around the United States, and has partnered with Global Energy Monitor to further research, document, and map many more of these cryptocurrency mining operations. Our interactive map shows how widespread these facilities are throughout many parts of the United States. Note that information regarding these facilities may have changed since this map was last updated in November 2022.
Because there is no centralized registry or clearinghouse for this elusive industry, it is challenging, if not impossible, to maintain an up-to-the-minute and comprehensive tally of all the locations, sizes, and other details about where new cryptocurrency mining facilities are emerging. The economic and physical landscape of cryptocurrency mining is in constant flux as new energy sources are considered and others ruled out, companies expand while others consolidate or close, and climate legislation evolves. In addition, as various currency platforms choose to shift from energy-intensive strategies to those that are vastly more energy-efficient, we may see additional contractions or expansions of operations.
As of our most recent tally in late November 2022, we have information on 165 sites throughout the United States that are, or have been, associated with cryptocurrency mining. Of these 165 facilities, 84 are thought to be currently operating, 41 are proposed, 7 are under construction, and two have been defeated. The status of the remaining 33 is unknown.
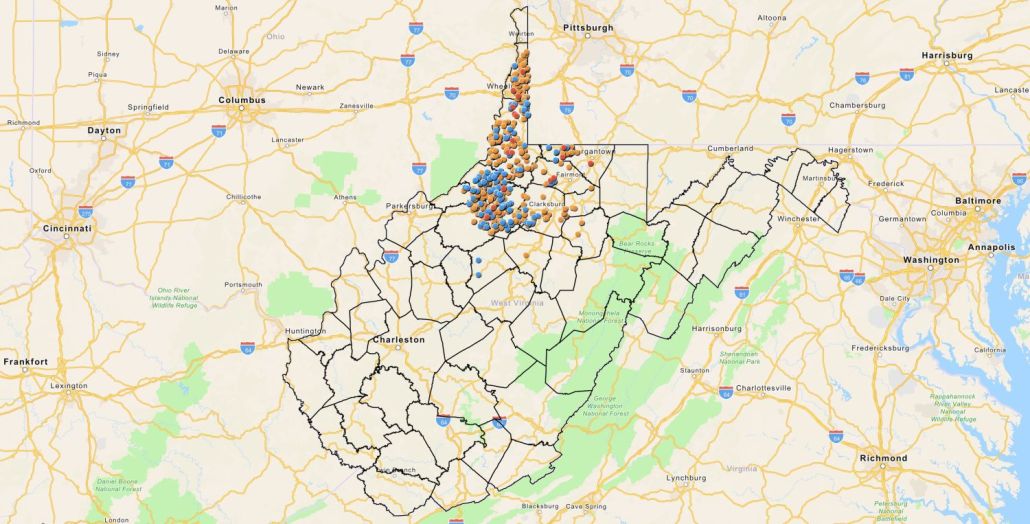
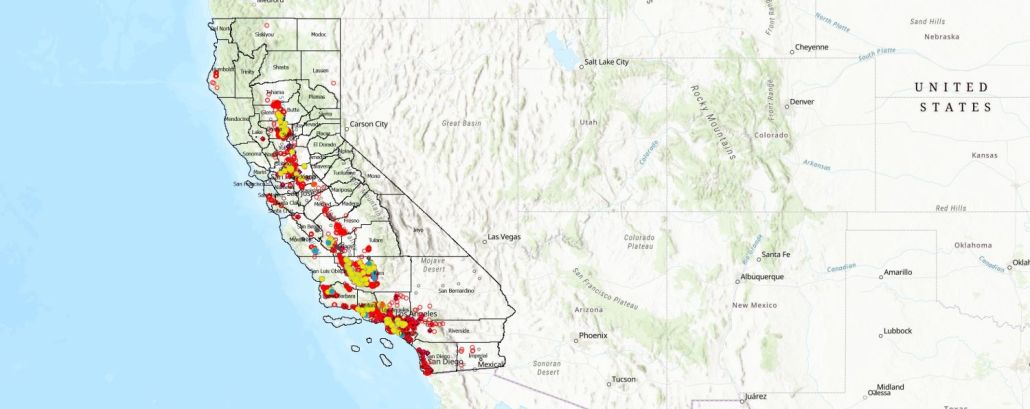
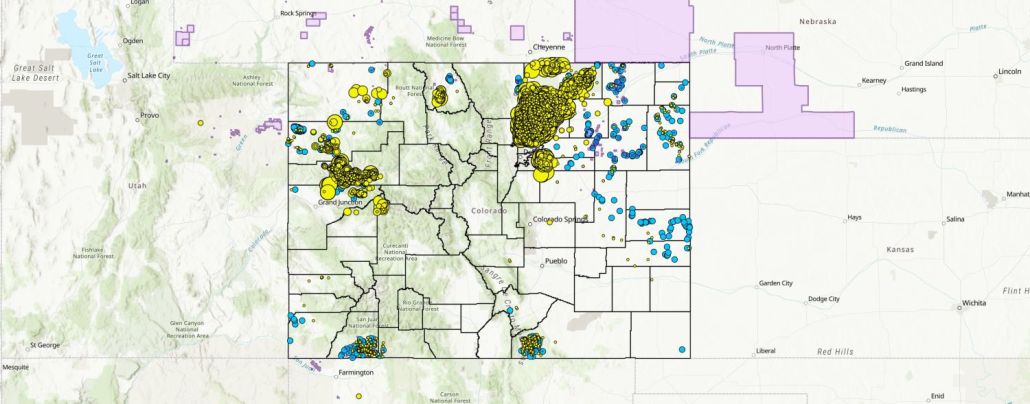
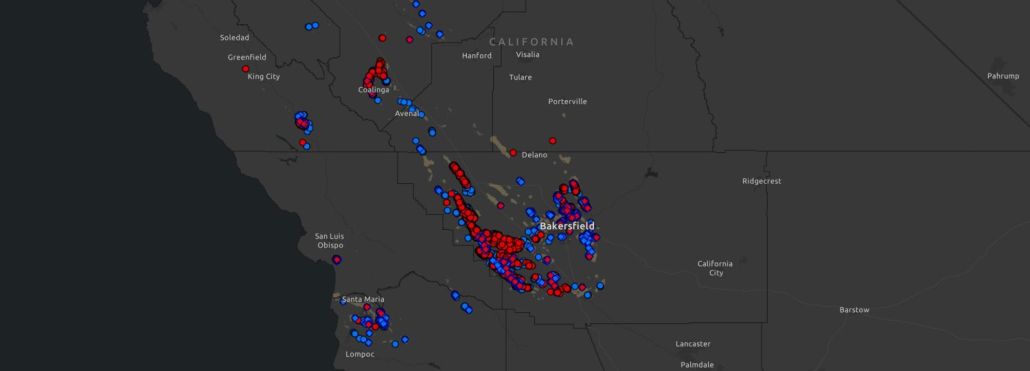
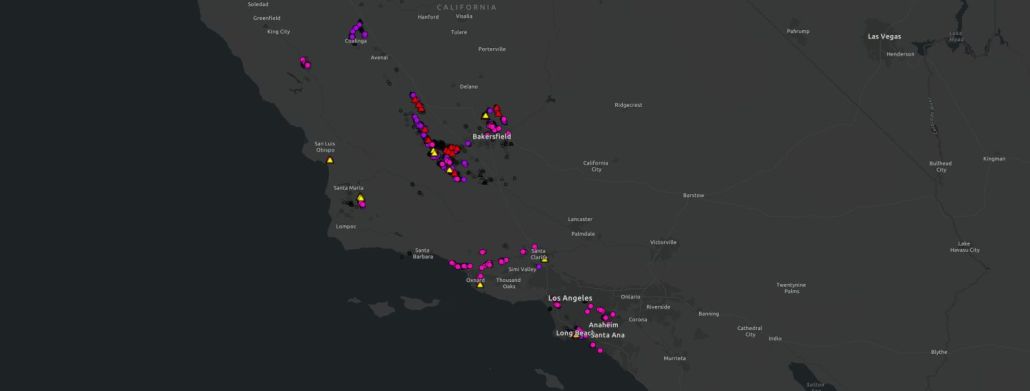
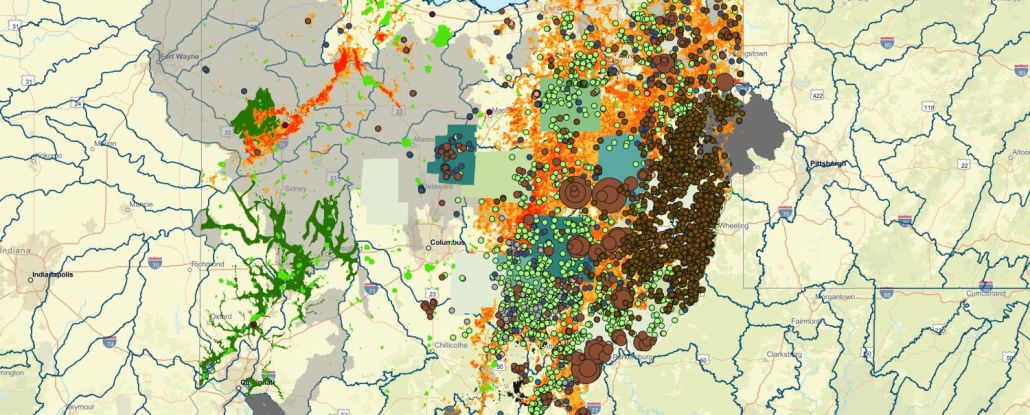
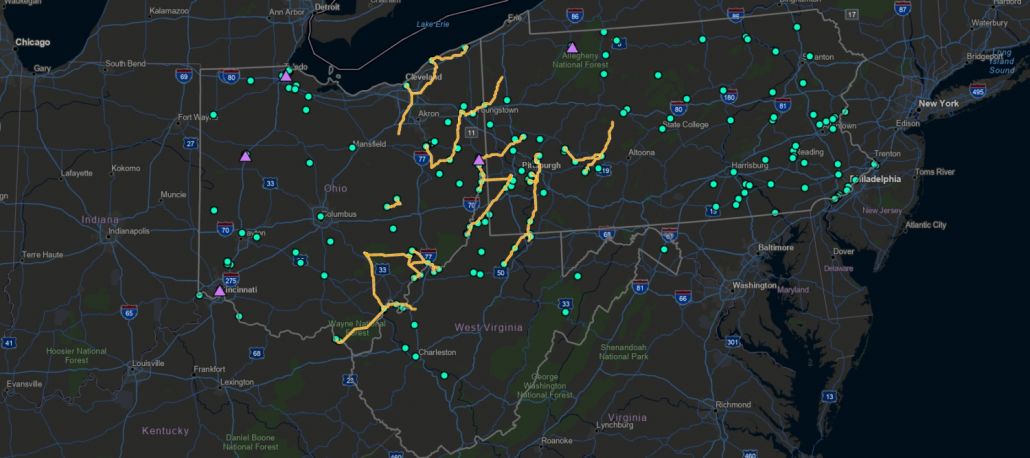
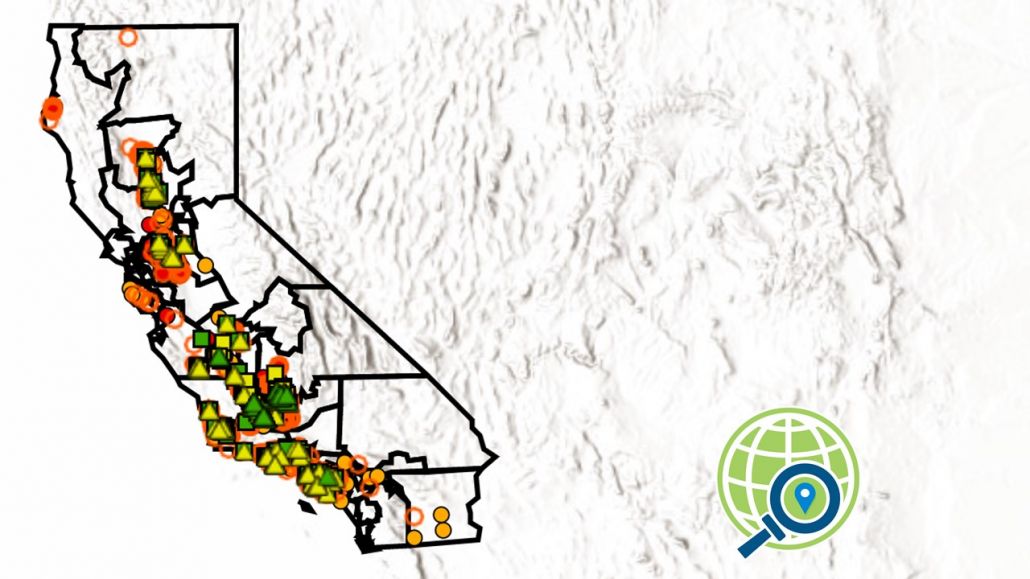
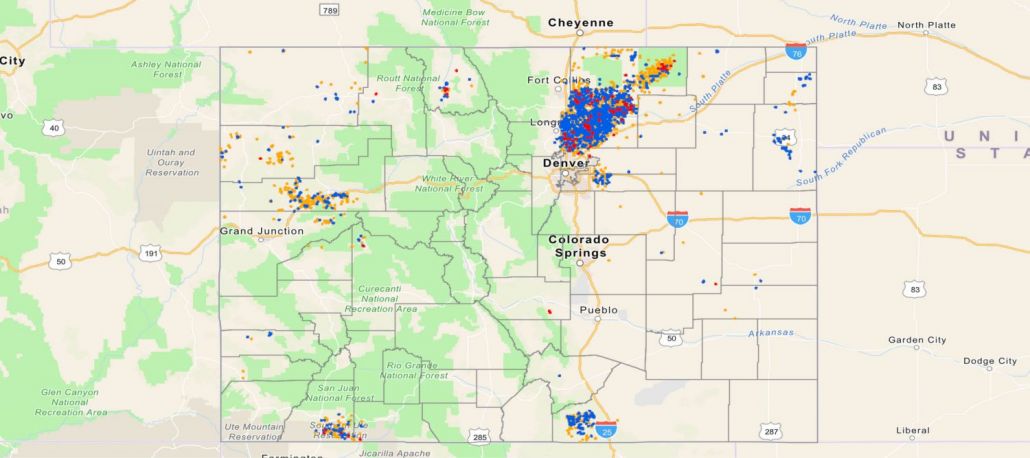
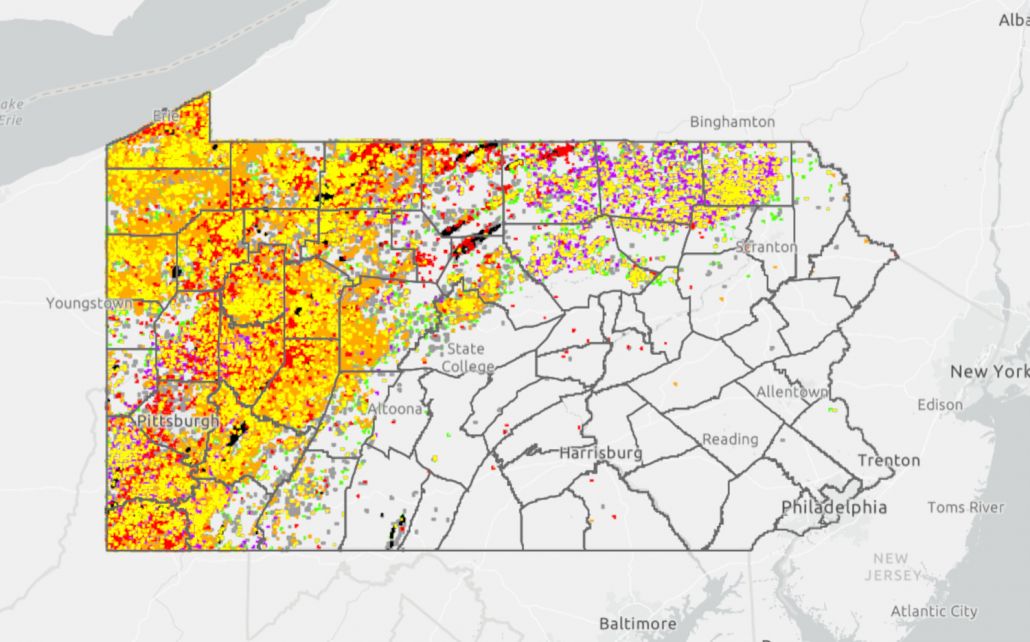
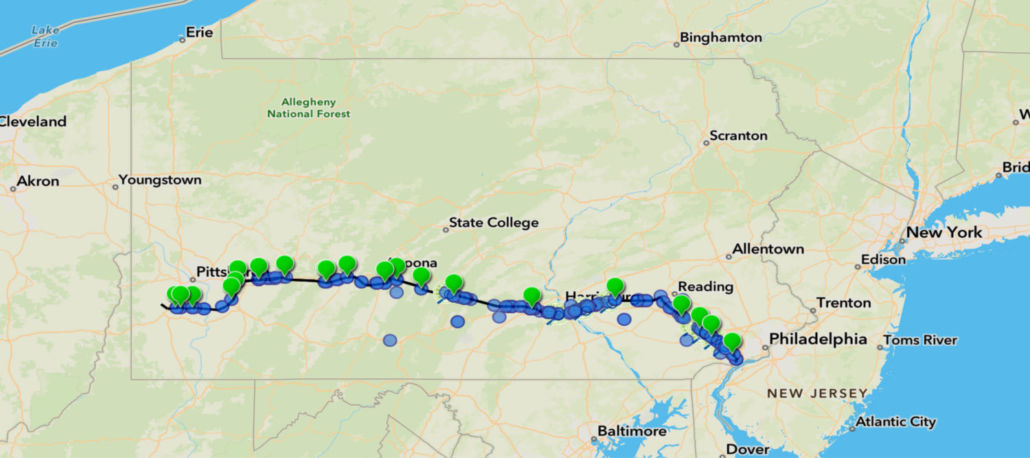
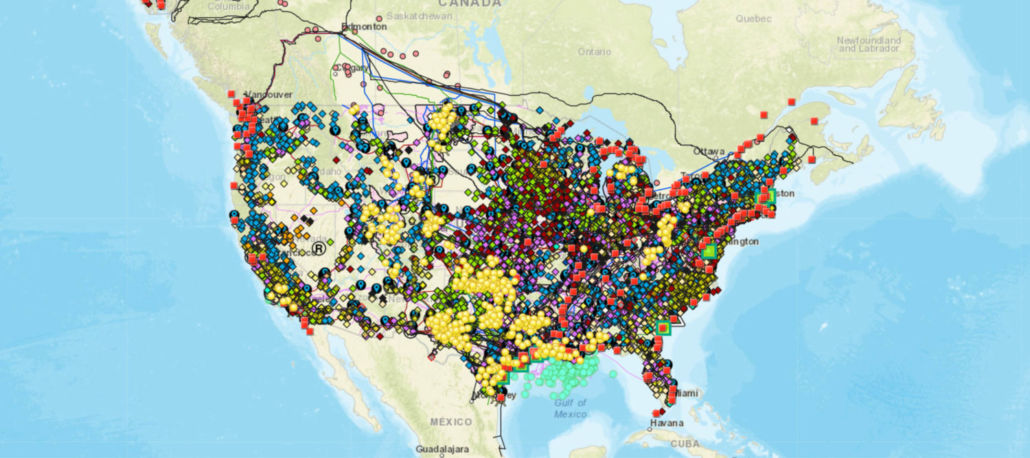
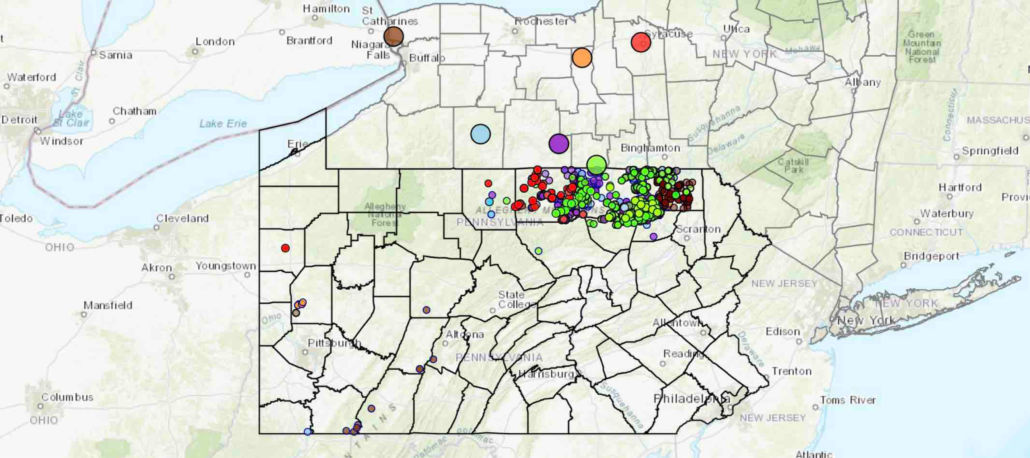
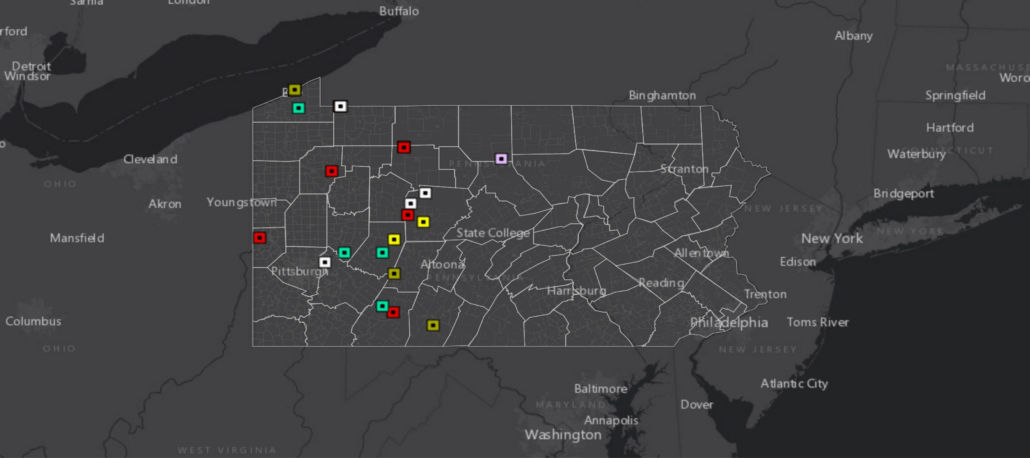
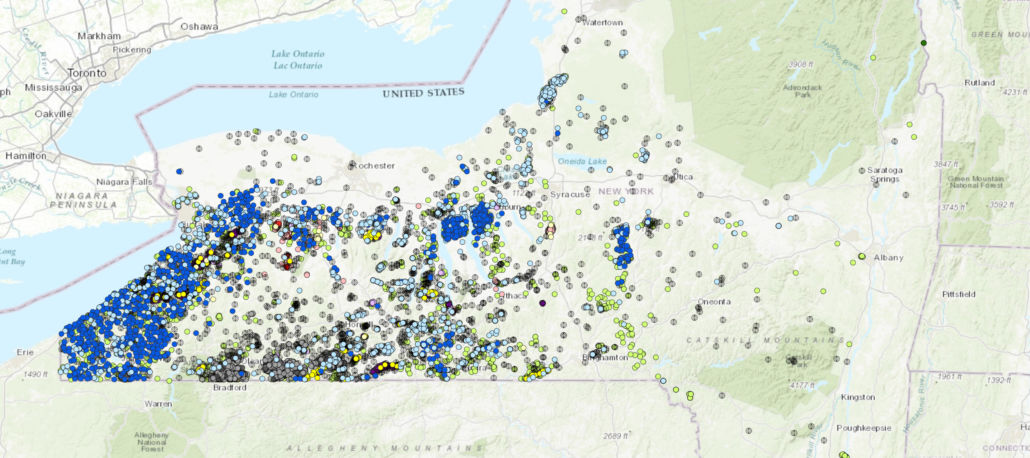
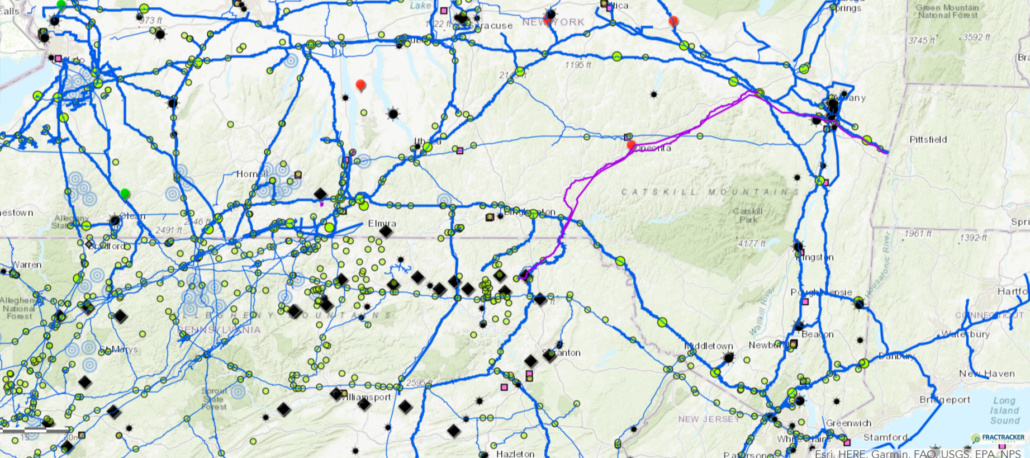
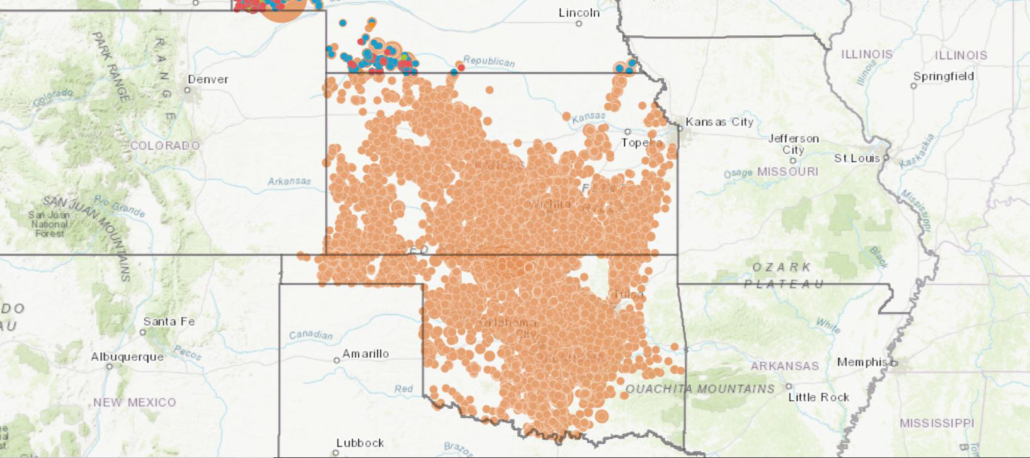
Cryptocurrency mining operations in the U.S.
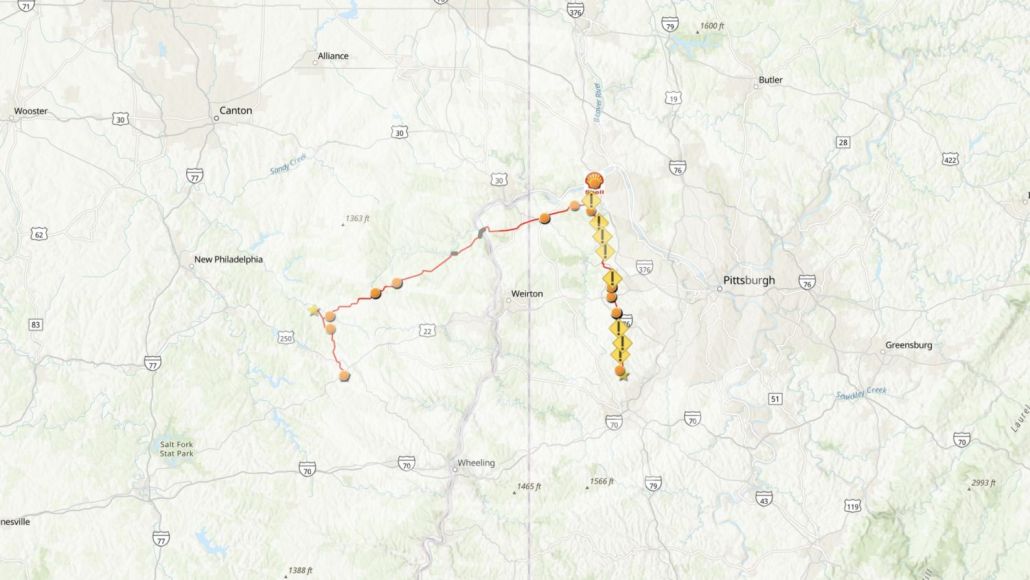
This interactive map looks at the locations of cryptocurrency mining operations in the U.S.
View the map “Details” tab below in the top right corner to learn more and access the data, or click on the map to explore the dynamic version of this data. Data sources are also listed at the end of this article.
In order to turn layers on and off in the map, use the Layers dropdown menu. This tool is only available in Full Screen view.
Items will activate in this map dependent on the level of zoom in or out.
View Full Size Map | Map is updated regularly as new information becomes available. Updates are reflected in the pop-up boxes associated with each facility. | Map Tutorial
Part I
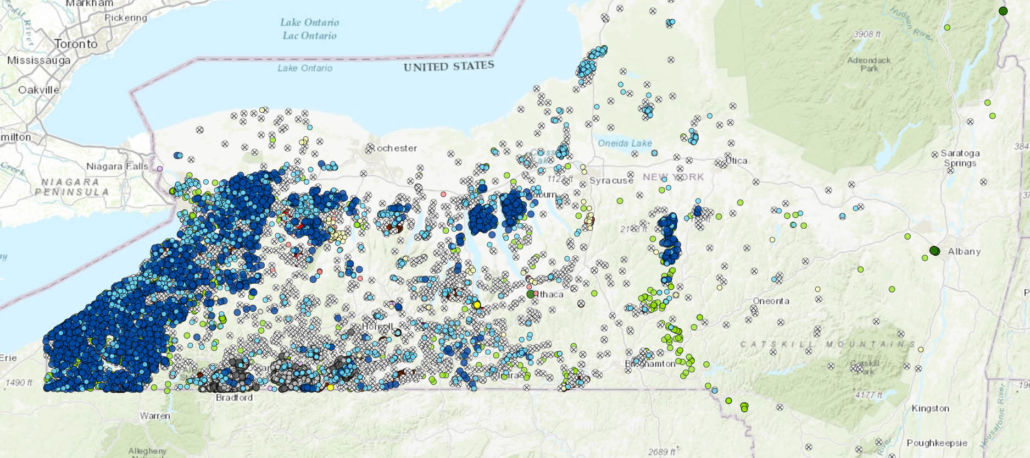
Where are they?
Because the cryptocurrency mining industry lacks much, if any, standardized or centralized reporting of locations or energy consumption, this may be the most comprehensive view of the geography of the cryptomining industry available. While initially, it seemed likely that large-scale mining operations would be housed in retired power plants, these arrangements actually account for relatively few of the nearly 150 sites we have documented. Locations are often not revealed by companies, frequently couched under benign references to “datacenters,” tucked into existing or shuttered industrial facilities, or in specialized mobile trailer units. Sometimes we learn of them when they are mentioned by local media, industry press releases, permit applications, or complex Securities and Exchange Commission (SEC) filings. The map represents our collective efforts, to the best of our knowledge, of the locations of these mining facilities. Precise locations of facilities are included only when available through our investigations, and that level of accuracy is indicated in the pop-ups connected with each location on the map. Information on energy quantities consumed by these operations is often ambiguous or unavailable, so for consistency, we do not show that on the map. In addition, facility or company names may change subsequent to our collection of that information.
This search for all the cryptomining facilities in the US will never be complete; this industrial landscape is continually shifting as companies close, open, or uproot and move to areas of cheaper power. These expansions of the proof-of-work footprint put additional strain on the grid and on our environment as a whole, driving the argument towards more oil and gas drilling to power new or expanded power plants.
A slow-down?
In the weeks since the “Energy Bomb” report was released, there have been numerous interesting updates involving cryptocurrency.
Ethereum, one of the most popular proof-of-state cryptocurrencies outside of Bitcoin, switched its validation process from proof-of-work to proof-of-stake, dropping its energy consumption per transaction by more than 99.99%. Prior to the switch from proof-of-work to proof-of-stake, Ethereum used 30,000 times more energy than it now does. This switch has enormous implications for the energy footprint about which cryptocurrency mining is most vociferously criticized. Please note that this is not an endorsement for or against Ethereum, and FracTracker does not provide investment recommendations.
The graph below, as of November 29, 2022, illustrates the switchover from POW to POS on September 15, 2022. That date is represented by the gray dot. Note that the value of Ethereum was not significantly impacted since the switch, although its environmental footprint shrank dramatically.

Figure 1. This graph, as of November 29, 2022, illustrates the switchover from POW to POS on September 15, 2022. Source: finance.yahoo.com
Compare Bitcoin’s value fluctuation over that same period. The level of trading for Bitcoin nearly parallels that of Ethereum, suggesting that Ethereum’s value didn’t decline significantly in comparison to a currency that did not shift from proof-of-work to proof-of-stake.

Figure 2. As of November 29, 2022, Bitcoin did not shift from proof-of-work to proof-of-stake. The level of trading for Bitcoin nearly parallels that of Ethereum. Source: finance.yahoo.com
Cryptocurrency bankruptcies
The instability and volatility of cryptocurrency has always been a hallmark of this risky realm of investment, which is not backed by the Federal Deposit Insurance Corporation (FDIC). Numerous crypto companies have failed due to bankruptcy, including Bahamas-based cryptocurrency exchange FTX and then Bermuda-based BlockFi in November 2022. In a domino-effect response, the instability ripples spread to Bitcoin (-1.4%), Ether (-2.2%), BNB (-5.55), and Solana (-5%). In July 2022, cryptocurrency trading platforms Voyager and Celsius also went bankrupt, as well as Three Arrows Capital. Hodlnaut followed in August 2022. Other prior crypto bankruptcies that led to company shut-downs include Blockchain Global (November 2021), ACX (February 2020), FCoin (February 2020), Cryptopia (May 2019), and Mt. Gox (2014).
As profit margins for cryptocurrency narrow, miners are now also defaulting on equipment purchase loans. Because the value of mining rigs has dropped up to 85% in the past year, lenders cannot recoup these debts by seizing the unpaid-for assets.
NYS Moratorium
New York State has long been in the forefront of legislation aimed at reducing climate impacts. The state passed a state-wide ban on high-volume hydraulic fracturing in 2014, and has been a leader nationwide in establishing aggressive energy reduction goals through the Climate Leadership and Community Protection Act (CLCPA), passed in 2019. CLCPA has been a rallying cry for stopping power plant conversions or construction at Damskammer and Astoria, as well as blocking air quality permit renewals that would have negatively impacted these CO2 and methane reduction goals.
Gravely concerned with the climate impacts created by fossil-fuel energy-guzzling proof-of-work cryptocurrency mining, New York State lawmakers passed a landmark bill that placed a two-year moratorium on new cryptocurrency mining operations at fossil fuel-powered energy facilities in New York. The bill, approved by both the New York State Assembly and the New York State Senate, sat unsigned on Governor Kathy Hochul’s desk for six months. Only after the November 2022 elections did the governor sign the bill. While the bill is far less comprehensive in its reach than it was in an earlier form (early versions sought a moratorium on all cryptocurrency mining), it may be far-reaching in outcomes. In addition to limiting new operations at existing power plants, it requires New York State to take a comprehensive look at how the cryptocurrency mining industry impacts greenhouse gas emissions.
Part II
Highlights of the “Energy Bomb” report
In their report, EarthJustice and Sierra Club estimate that between July 2021 and June 2022, Bitcoin mining consumed as much energy as was used in the entire states of Maine, New Hampshire, Vermont and Rhode Island combined: 36 billion kWh. And during that period, cryptomining energy consumption—from power plants, low-producing oil and gas wells, and flared gas capture—added more than 27 million tons of CO2 to the atmosphere.
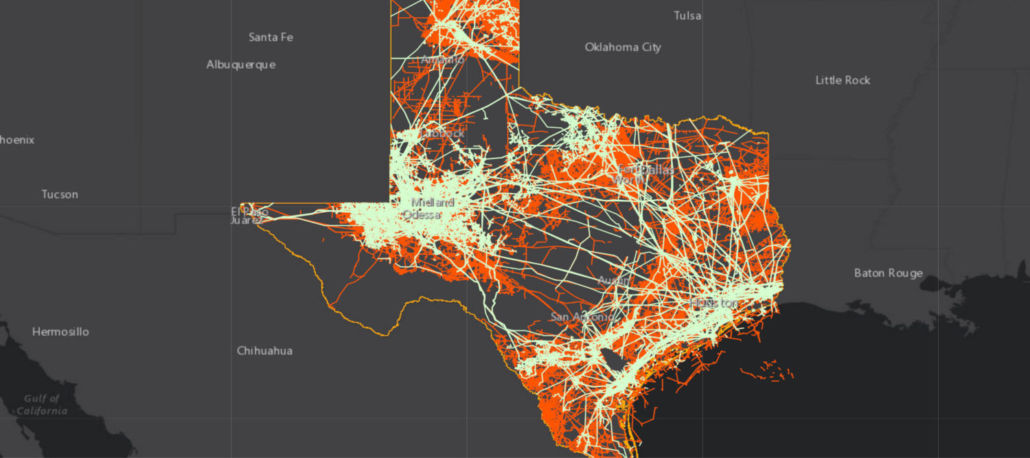
Texas, with its already strained electrical grid, is positioning itself to be a center of cryptomining in the US.

Figure 3. Projected growth of cryptocurrency mining in Texas. Source: THE ENERGY BOMB (September 2022)
With corporate pressure for exponential growth in cryptomining in sunny and wide-open areas like Texas, some mining companies are moving off-grid by constructing massive solar farms to power their operations. They promote their work as “sustainable” or “carbon neutral”—greenwashing a process that continues to be, more broadly, so damaging to the climate. While the cryptomining industry likes to promote the use of solar energy to run their computers, efforts towards broad-scale solarization should instead be directed towards home and vehicle electrification.
In their report, EarthJustice and Sierra Club eloquently lay out how cryptocurrency mining has grown over the past five years from small-scale individual operations to a largely unregulated commercial force that threatens world climate, economies, and human and environmental health.
The report takes a hard look at the dominant myths surrounding proof-of-work cryptomining, shining a laser beam on the false arguments that have, nonetheless, allowed the industry to see exponential expansion. The industry has grown despite many well-known risks, not the least of which is its volatility, cryptocurrency’s lack of environmental sustainability or carbon neutrality, and its false claim of being able to stabilize the grid through load balancing.
Importantly, EarthJustice and Sierra Club conclude their document with recommendations on ways to minimize the abundant risks posed by proof-of-work cryptocurrency mining in local communities. They focus on ways to mitigate air, water and solid waste impacts; establish more fair policies around economic development incentives extended to crypto operations; demand that mining operations bear responsibility for grid and infrastructure strain; ensure better fire safety at mining sites; address noise pollution; and implement land-use codes that protect communities from deleterious impacts of these industrial scale operations.
The Take Away
FracTracker’s map shows more than 150 sites throughout the United States where energy-intensive proof-of-work cryptocurrency mining is occurring. There are—undoubtedly—more locations springing up every month, even as the cryptomining industry’s profit margin has decreased to close to zero. If you have a cryptocurrency mining operation in your community that is not on our map, please report it to us via this form, and we will do our best to gather more information on the operation and add it to our map. Corrections or updates are most welcome. We will do our best to update this map monthly.
Kudos to EarthJustice and Sierra Club for sharing such a clearly thought-out warning about the devastating impacts of proof-of-work cryptocurrency mining, and to Global Energy Monitor for their research and documentation efforts in helping to identify the facilities we present in our map. FracTracker strongly supports this work as a critical road map for turning around the harms brought on by an industry that seems to be willing to risk climate chaos in order for a relatively tiny fraction of the world to get rich quick.
References & Where to Learn More
Topics in This Article:
Join the Conversation
Stay Informed
Support Our Work
FracTracker Alliance helps communicate the risks of oil and gas and petrochemical development to advance just energy alternatives that protect public health, natural resources, and the climate.
By contributing to FracTracker, you are helping to make tangible changes, such as decreasing the number of oil and gas wells in the US, protecting the public from toxic and radioactive chemicals, and stopping petrochemical expansion into vulnerable communities.
Your donations help fund the sourcing and analysis of new data so that we can keep you informed and continually update our resources.
Please donate to FracTracker today as a way to advocate for clean water, clean air, and healthy communities.
What You Should Read Next

 FracTracker Alliance, 2024
 Great Plains Action Society
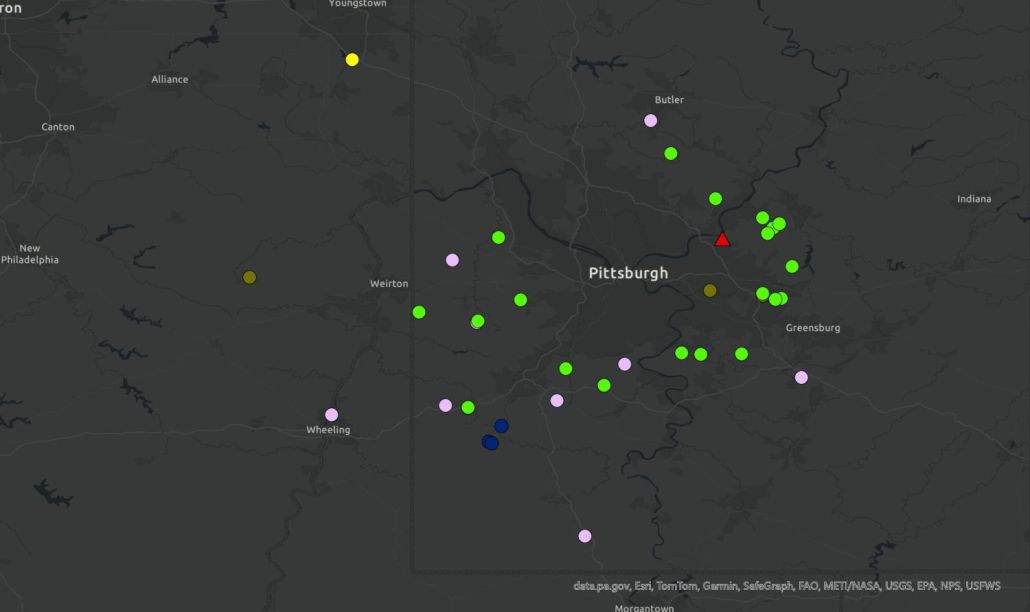

 FracTracker Alliance, 2024
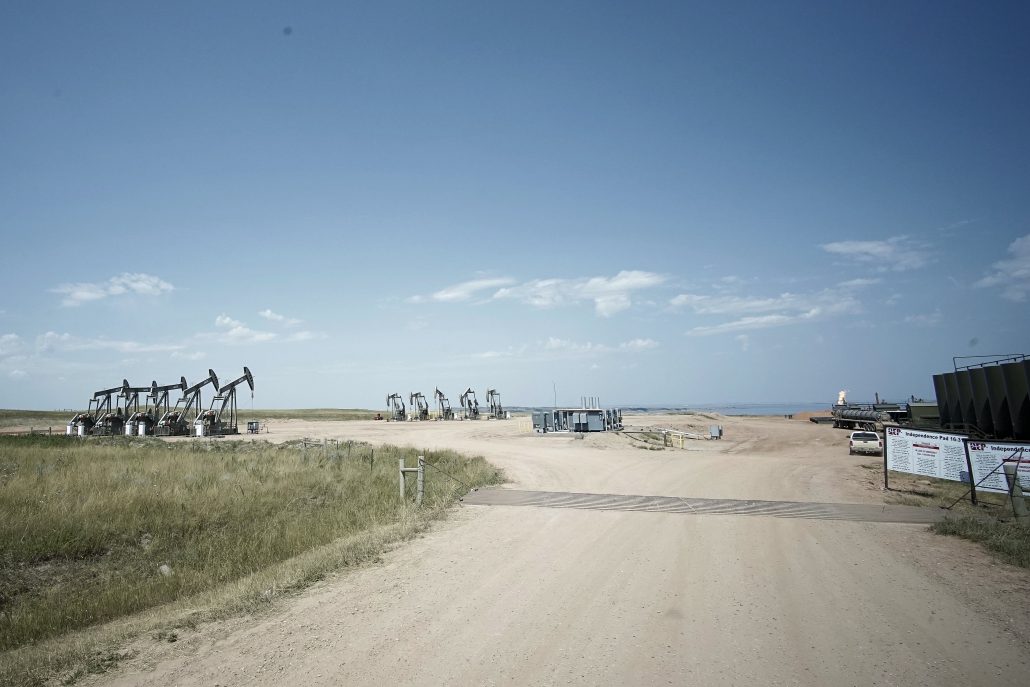


 FracTracker Alliance, 2024
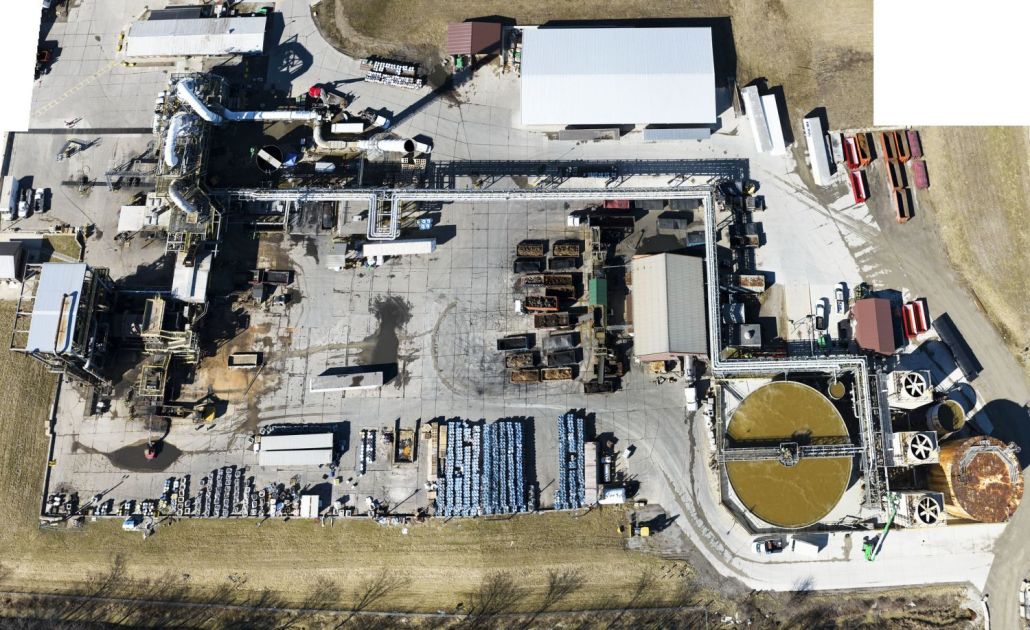 Ross incinerator in Eaton Township. Photo by Ted Auch, FracTracker Alliance, 2023
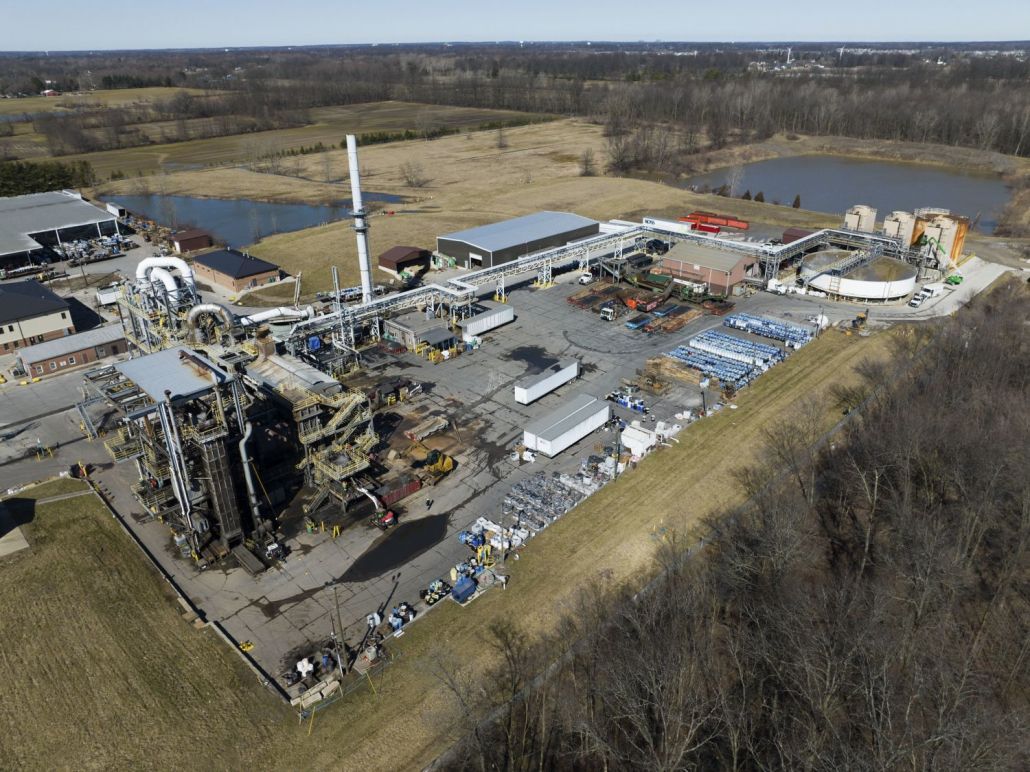 Ross Environmental Hazardous Waste Incinerator in Eaton Township, Ohio. Ted Auch, FracTracker Alliance, 2023
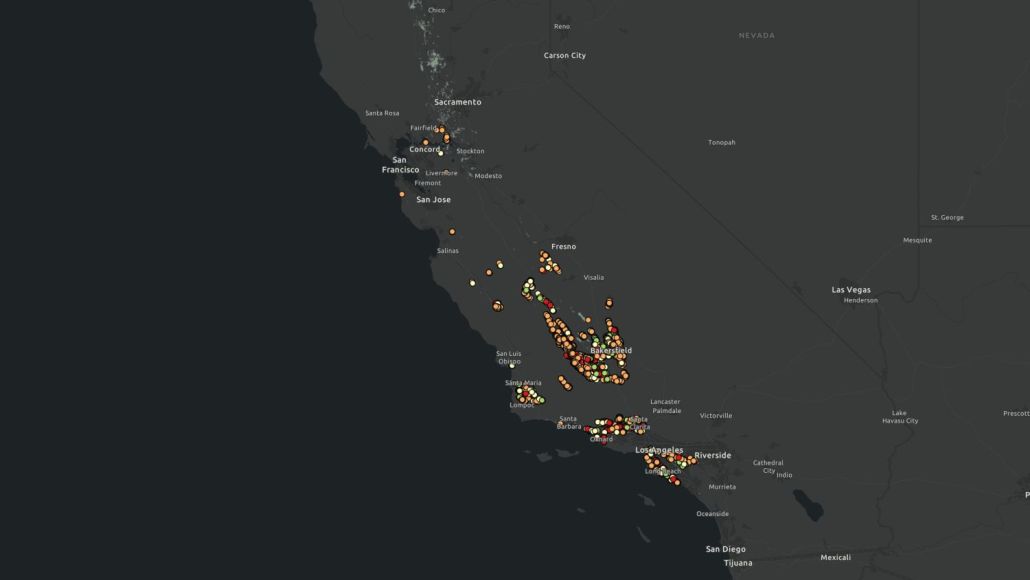 FracTracker Alliance, 2024
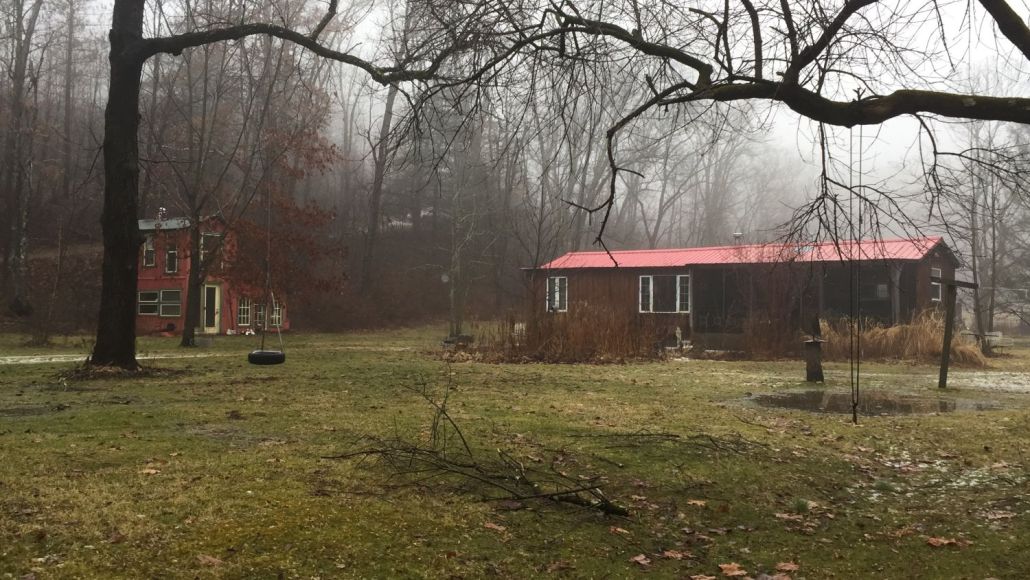 The cottage along Slope Creek, months after being vacated due to health concerns caused by nearby oil and gas operations. Photo courtesy of Chloe Mankin
 Matt Kelso, FracTracker Alliance, 2023
 Sarah Carballo, FracTracker Alliance, 2022
 Ted Auch, FracTracker Alliance, 2022


 EPA
EPA Jared Durelle
 FracTracker Alliance, 2021

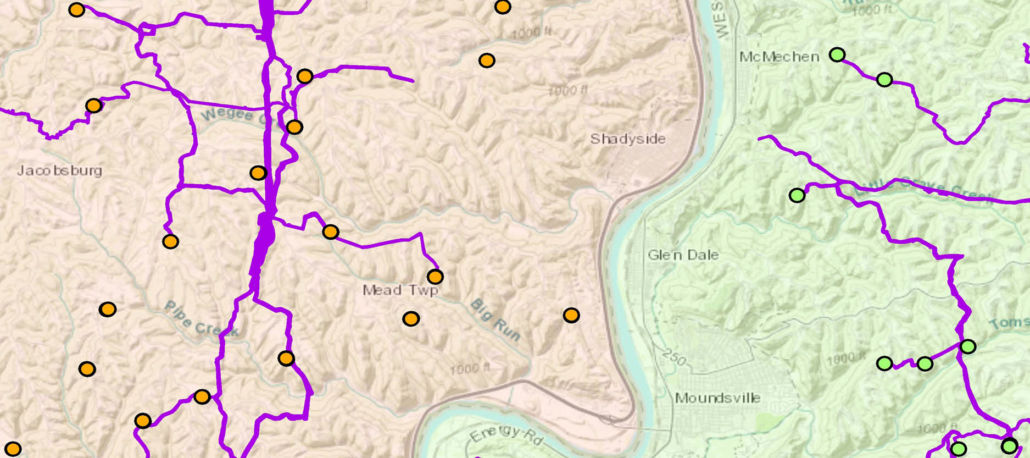
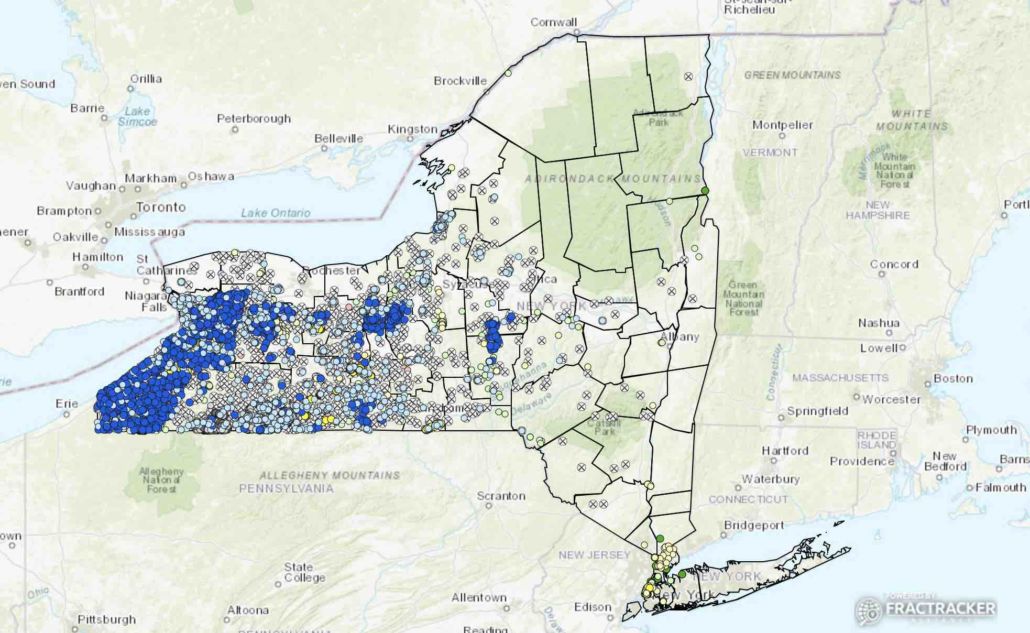


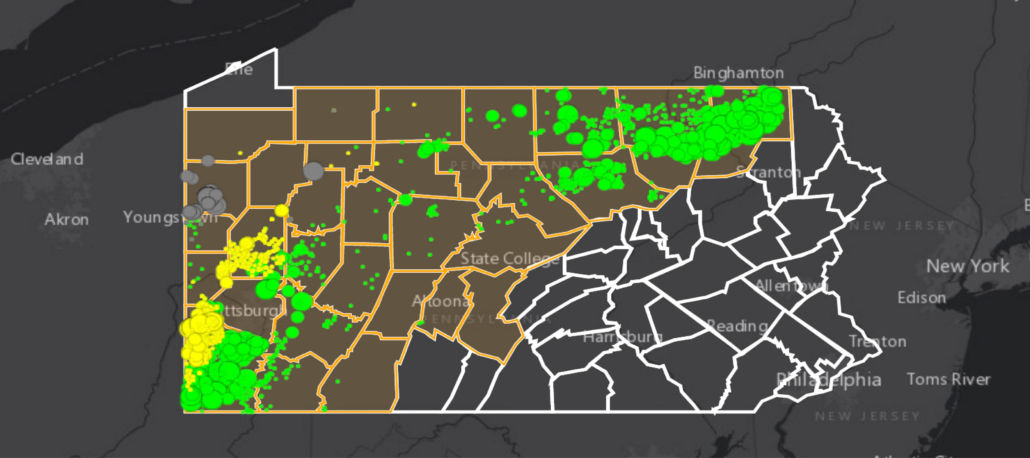
 Photo by Ted Auch, FracTracker Alliance

![]()
216 Franklin St, Suite 400, Johnstown, PA 15901
Phone: +1 (717) 303-0403 | info@fractracker.org
FracTracker Alliance is a 501(c)3 non-profit: Tax identification number: 80-0844297
Thanks for sharing
Best written article nice sharing…
thanks for providing information about crypto mining operation
THANKS FOR GIVING INFORMATION
FracTracker’s map shows more than 150 sites throughout the United States where energy-intensive proof-of-work cryptocurrency mining is occurring. thank you for the information
thank you for wonderful information