Overview
The standard 12-lead electrocardiogram (ECG) is one of the most commonly used medical studies in the assessment of cardiovascular disease. [1] It is the most important test for interpretation of the cardiac rhythm, detection of myocardial ischemia and infarction, conduction system abnormalities, preexcitation, long QT syndromes, atrial abnormalities, ventricular hypertrophy, pericarditis, and other conditions. [2, 3, 4, 5, 6, 7] The use of standardized terminology is recommended to allow application of ECG diagnoses across many different hospital systems and countries. [7]
Modern technology has also opened up the possibilities for ambulatory heart rhythm diagnostics, such as the use of smartphones to potentially diagnosis atrial fibrillation or atrial flutter without confirmatory ECGs. [8] Computerized ECG interpretation [9] and the advent of machine learning has and is helping to improve clinicians' interpretation and analysis of ECGs. [10]
History of the ECG
The ECG has its roots in the seminal work of Galvani, who famously noted the contraction of frog legs when stimulated with electricity. [11] Although he was incorrect in attributing this phenomenon to "animal electricity," his findings ushered in a period of research in the interaction of electricity and biological systems.
Matteucci, and later Kolliker and Muller, demonstrated that the electrical activity of a beating heart caused synchronous contractions in muscle preparations that were connected to the heart by nerve tissue. [12, 13] Gabriel Lippman developed the capillary electrometer, making it possible to measure the minute currents in biological systems. [14] With the Lippman electrometer, Agustus Waller performed the first ECG of a human heart at St Mary’s Hospital in London in May 1887. [15]
Willem Einthoven improved the ECG using the Lippman electrometer and then introduced the string galvanometer, which represented a great leap forward in electrocardiography. [16] With Einthoven’s improvements, the now familiar P, Q, R, S, and T waves were apparent.
Not only did Einthoven reveal the ECG waveforms as we know them today, but his convention for placement of the ECG leads is still in use, with leads on the right and left arms as well as the left leg, using the right leg as an electrical ground. With these leads, he demonstrated the well-known "Einthoven’s triangle" (see the image below).
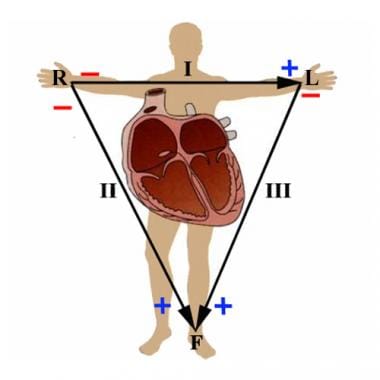 I, II and III represent the original three leads used by Einthoven. These describe the electrical vector between the right and left arms, right arm and left leg, and left arm and left leg, respectively. R, L, and F represent the augmented limb leads aVR, aVL, and aVF. They are calculated as follows: aVR = (I+II)/2 , aVL = (I-III)/2, aVF = (II+III)/2.
One of Einthoven's students, Sir Thomas Lewis, used electrocardiography to reveal the mechanisms behind atrial fibrillation and other conduction abnormalities. In the United States, Wilson and Goldberger pioneered the use of additional leads, namely aVR, aVL, aVF, and the 6 precordial leads (see the images below). [17, 18]
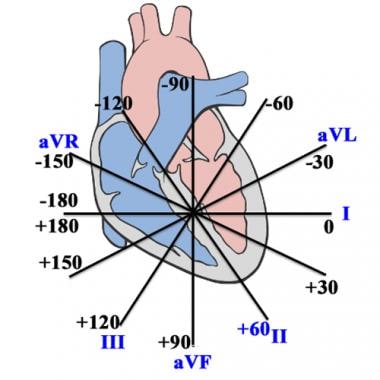 The hexagonal reference system is the standard method of determining the axis of electrical activation of the heart. As an example, depolarization parallel with lead II would yield a value of 60º, whereas a depolarization vector in the opposite direction would be -120º.
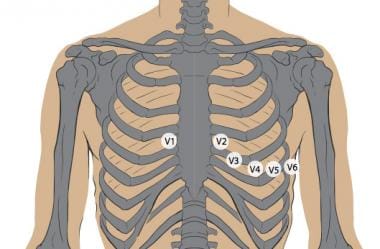 Proper placement of the precordial leads for standard 12-lead electrocardiography.
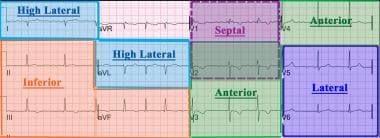 A 12-lead electrocardiogram is divided into the following four main contiguous lead groups: inferior, lateral, septal, and anterior.
After these advancements, the ECG as we know it today was created and, except for advances in the technology, it has changed little over the last 50 years.
Additional resources
For more information, see the following resources:
-
For a concise review of the recognition of artifacts which may be introduced by lead misplacement, see Surawicz, B, Knilans T, Chou TC. Chou’s Electrocardiography in Clinical Practice: Adult and Pediatric. 5th ed. Philadelphia, Pa: WB Saunders and Co; 2001:576-82.
-
For further information on the technical standards of ECG recording devices, the see the Association for the Advancement of Medical Instrumentation (AAMI) and the American National Standards Institute (ANSI).
ECG Indications and Contraindications
Indications
The electrocardiogram (ECG) has proven to be among the most useful diagnostic tests in clinical medicine. It is routinely used in the evaluation of patients to detect myocardial injury, ischemia, and the presence of prior infarction, and in the assessment of patients with electrolyte abnormalities, drug toxicities, and implanted defibrillators and pacemakers.
In addition to its usefulness in the evaluation of ischemic coronary disease, the ECG, in conjunction with ambulatory ECG monitoring, is of particular use in the diagnosis of disorders of the cardiac rhythm and in the evaluation of syncope. Other common uses of the ECG include the assessment of metabolic disorders and side effects of pharmacotherapy, as well as the evaluation of primary and secondary cardiomyopathic processes, among others. [19]
The ECG is also used by athletic associations for screening evaluation of participants' cardiac health. In a cross-sectional study of ECGs performed on 173 elite female professional basketball athletes, investigators found that among 136 athletes who had training-related ECG changes, 64 women (47.1%) had left ventricular structural adaptations related to athletic remodeling; of 8 athletes who had abnormal ECG findings, 3 women (1.7%) had T-wave inversions, 2 (1.2%) had Q waves, and 2 (1.2%) each had prolonged QTc intervals or frequent premature ventricular contractions. [20]
A study of 116 elite US male and 128 female soccer players found that female players were more likely to have abnormal ECG patterns (11%) and both male and female player often exceeded normality cut points for remodeling-associated echocardiographic parameters. European researchers created a comprehensive and 12-ECG dataset that comprises data from 54 elite male football (soccer) players collected over five phases and multiple seasons, encompassing 163 10-second ECG recordings, to provide detailed analyses of at-rest heart activity and cardiac health in this population of athletes. [21]
Appropriate ECG interpretation and echocardiographic evaluation is also essential when assessing athletes of other ethnicities as well as young athletes. For example, Southeast Asian athletes appear to not only have a higher rate (6.7% higher) of abnormal ECGs relative to their White counterparts, but they also have structural echocardiographic differences such as smaller left ventricular cavity sizes and wall thicknesses compared to non-Asian athletes. [22] Appropriate evaluation of resting ECG and imaging of pediatric sport participants is crucial for early detection of life-threatening conditions, therapeutic management, and sports competition eligibility in this young population. [23]
Contraindications
No absolute contraindications to performing an ECG exist, other than patient refusal. Some patients may have allergies or, more commonly, sensitivities to the adhesive used to affix the leads; in these cases, hypoallergenic alternatives are available from various manufacturers.
Preparation
Equipment
The various components of an electrocardiogram (ECG) (ie, P wave, QRS complex, and T wave) have different and distinct amplitudes and frequencies. Devices that record these signals must make use of various signal filtering and amplification algorithms to produce a clinically useful signal while excluding unwanted signals (such as those resulting from skeletal muscle, respiratory variation, and electromagnetic interference from nearby equipment).
Currently, most ECG recording machines are digital (as opposed to the analog devices used previously). The American College of Cardiology (ACC), in conjunction with the American Heart Association (AHA) and the Heart Rhythm Society (HRS), have published guidelines regarding the technical standards for ECG recording equipment. [24] These machines can autogenerate preliminary findings based on morphology criteria.
In order to compensate for the effect of low-frequency signals, such as those due to chest wall movement with respiration, while also minimizing the effects of extraneous high frequency on the fidelity of the recordings, various filters must be applied to the raw electrical signal. For the current digital systems in use, these low-frequency and high-frequency cutoff values are 0.5 Hz and 150 Hz, respectively, for adult ECG. In pediatric ECG, the high-frequency filter should be increased to 250 Hz. Additional guidelines are given with respect to signal amplification, compression, and storage; these are beyond the scope of this article.
Positioning
The standard 12-lead ECG is generally performed with the patient lying quietly in the supine position. Care should be taken to ensure that the skin is clean and trimmed of excess hair in the areas in which the leads are to be placed. In some instances, a mild abrasive pad can be used to prepare the skin in these areas to aid in apposition of the leads.
Technique
After preparation of the patient, apply the electrocardiographic (ECG) leads in the manner outlined below.
It is recommended that the standard limb leads are placed one on each limb distal to the shoulders and hips, but they do not necessarily need to be as far distal as the wrists and ankles. [24] Next, apply the precordial leads, taking care to be as precise as possible in their positioning.
Lead V1 is placed at the fourth intercostal space at the right sternal border. [24] Lead V2 is placed at the left sternal border directly across from lead V1, also in the fourth intercostal space. Lead V4 is placed in the fifth intercostal space at the mid clavicular line, and then lead V3 can be placed midway between leads V2 and V4. Lead V6 is placed in the horizontal plane of V4 at the mid-axillary line, and then lead V5 is placed in the same horizontal plane as that of lead V4 in the anterior axillary line or midway between leads V4 and V6 when the anterior axillary line is not readily discernible.
Note that precordial electrode placement in women with large breasts can be problematic due to obfuscation of bony landmarks. Therefore, it is recommended that the electrodes be placed beneath, rather than overlying, the breast. [24]
The importance of proper lead placement cannot be stressed enough. Furthermore, properly trained ECG technologists have been noted to be more likely to properly place the leads than are nurses or physicians, including cardiologists. [25] Improper placement of the leads can yield a tracing that gives the appearance of disease where none is present or vice versa. [26]
Postprocedure
Once the ECG is completed, it should be reviewed by the operator. If significant issues with the quality of the tracing exist, the cause of the issue should be addressed and the tracing repeated. When this is impractical or impossible, the clinician ordering or reading the ECG should be notified for further guidance.
After having obtained an acceptable tracing, remove the ECG leads and help the patient off the examination table. In the event that the adhesive from the electrodes is not easily removed from the skin, the patient may be given an alcohol pad or moist paper towel to aid in its removal.
Initial Review of the 12-Lead ECG
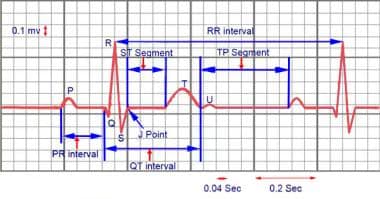
The initial review of the 12-lead electrocardiogram (ECG) should encompass the following: heart rate and rhythm, P-QRS-T morphology, presence of ST segment, and PR-QRS-QT intervals (see the image below). Each ECG should be thoroughly analyzed ("read") in a systematic fashion to avoid overlooking important abnormalities. The following steps are important to consider:
- Rate: Normal versus tachycardia versus bradycardia
- Rhythm: Abnormal versus normal sinus
- Intervals: PR, QRS, QT
- Axis: Normal versus left deviation versus right deviation
- Chamber abnormality: Atrial enlargement, ventricular hypertrophy
- QRST duration: Q waves, poor R-wave progression, ST-segment depressions/elevations, or T-wave changes
The ECG grid
In the image below, the ECG is recorded on standard paper with large boxes in heavy lines of 0.5 cm on the sides. On the horizontal axis, each large box represents 0.2 seconds at a typical paper speed of 25 mm per second, which is then divided into five smaller boxes that each represent 0.04 seconds. On the vertical axis, the large box consists of five subdivisions, each of which is 1 mm in height. In standard calibration, each 10 mm equals 1 mV. The normal heart rate ranges from 60 to 100 per minute; rates below 60 per minute and, occasionally, lower than 50 per minute are routinely seen in seasoned athletes.
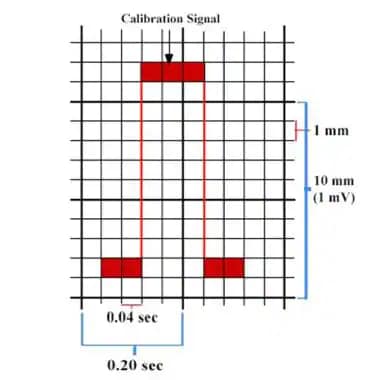 On standard calibration, each large box has sides of 0.5 cm. On the horizontal axis, each large box represents 0.2 seconds, and each smaller box represents 0.04 seconds. On the vertical axis, each small box is 1 mm in height; 10 mm = 1 mV.
Heart rate
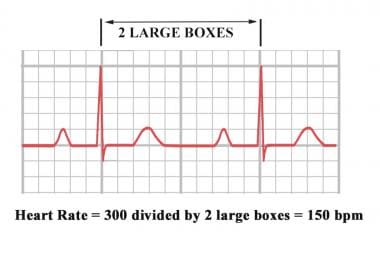
When the cardiac rhythm is regular, the heart rate can be determined by the interval between two successive QRS complexes. On standard paper with the most common tracing settings, the heart rate is calculated by dividing the number of large boxes (5 mm or 0.2 seconds) between two successive QRS complexes into 300. For example, if the interval between two QRS complexes is two large boxes, then the rate is 150 beats per minute (bpm) (300 ÷ 2 = 150 bpm). See the following images.
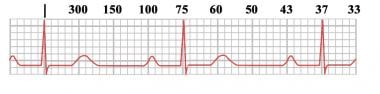 Heart rates associated with each of the large boxes in the following order are 300, 150, 100, 75, 60, 50, 43, 37, 33 beats per minute (bpm).
If the heart rate is irregular, count the number of QRS complexes on the ECG and multiply by 6 to obtain the average heart rate in bpm (the ECG displays a period of 10 seconds; thus, 6 × 10 seconds = 60 seconds [1 minute]).
The P wave
The P wave represents atrial depolarization. The normal P wave morphology is upright in leads I, II, and aVF, but it is inverted in lead aVR. The P wave is typically biphasic in lead V1 (positive-negative), but when the negative terminal component of the P wave exceeds 0.04 seconds in duration (equivalent to one small box), it is abnormal.
Left atrial enlargement should be suspected when the P wave duration is increased; it is associated with being more than one small box deep (>1 mm2) in lead V1 and a bifid P wave in lead II with a duration that is longer than 110 milliseconds. [27] Right atrial enlargement is associated with a peaked P wave taller than 2.5 mm in the inferior leads and more than 1.5 mm tall in leads V1 and V2. [28]
The PR interval
The PR interval incorporates the time from the depolarization of the sinus node to the onset of ventricular depolarization. The measurement starts from the beginning of the P wave to the first part of the QRS complex, with a normal duration between 0.12 to 0.20 seconds. [7]
The QRS complex
The QRS duration represents the time for ventricular depolarization. The duration is normally 0.06 to 0.10 seconds. Q waves are inscribed when the initial QRS vector is directed away from the positive electrode. The R wave is the first positive deflection of the QRS complex; its amplitude varies by age, race, and cardiac pathology, and it should increase across the precordium from leads V1 to V5. The negative deflection after the R wave is the S wave.
The ST segment
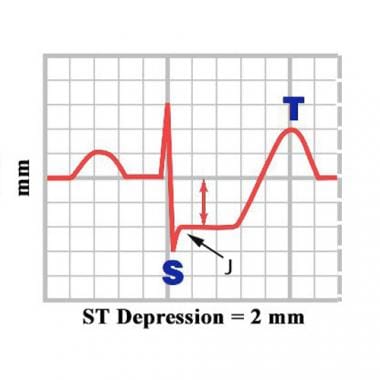
The ST segment is an interval between ventricular depolarization and ventricular repolarization. It is identified as the end of the QRS complex to the beginning of the T wave.
The end of the T wave to the beginning of the P wave is described as the TP segment, which is the zero potential or isoelectric point. The amount of elevation or depression in millimeters is relative to the TP segment.
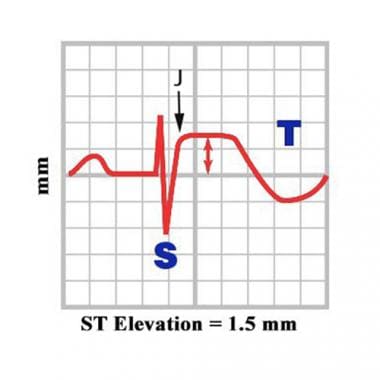
The J point is located at the junction between the end of the QRS complex and the beginning of the ST segment. J-point elevation is known as an Osborne wave, which represents distortion of the earlierst phase of membrane repolarization, and it is associated with hypothermia.
Myocardial ischemia diagnosed by ECG is an integral part of the acute coronary syndrome (ACS) treatment pathway and allows patient stratification into ST-segment elevation ACS (STE-ACS) and non-ST-segment elevation ACS (NSTE-ACS). [5, 29, 30] ST-segment wave changes may be in association with disease states such as acute ischemia, myocardial injury, pericarditis, and intraventricular conduction delays.
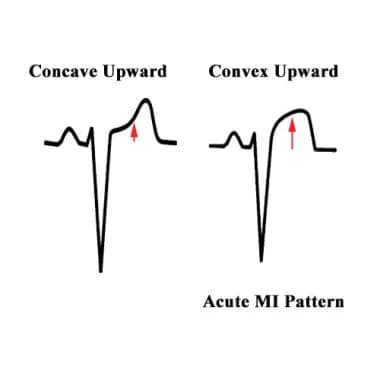
In the absence of left ventricular hypertrophy (LVH) and left bundle branch block (LBBB), new ST-segment elevation in upward convexity are signs of myocardial infarction (typically 60 msec following the J point in two contiguous leads [with cut-off points in leads V2-V3 of ≥0.2 mV in men ≥40 years, ≥0.25 mV in men ˂40 years, or ≥0.15 mV in women, and/or 0.1 mV in other leads for both men and women]). [31] New horizontal or down sloping ST depression that is 0.05 mV or more in two contiguous leads and/or T-wave inversion that is 0.1 mV or more in two contiguous leads, with a prominent R wave or an R/S ratio over 1, are also signs of myocardial infarction.
Coronary spasm may be associated with angina (Prinzmetal) and with transient ST-segment elevation in a coronary artery branch distribution that has the spasm.
Pericarditis is associated with ECG manifestations of diffuse upward concave ST-segment elevation with PR depressions.
See the following images.
The QT interval
The QT interval measures the depolarization and repolarizationof the ventricles. QT prolongation is associated with development of ventricular arrhythmias and sudden death. [32] It is commonly caused by various medications or can be a manifestation of an underlying ion channelopathy.
The QT interval is dependent on the heart rate. A faster heart rate leads to a shorter QT interval, whereas a slower heart rate leads to a longer QT interval. A corrected QT interval (QTc) corrects for the variations in heart rate. QTcb is the QT interval divided by the square root of the RR interval in seconds when using the Bazett formula. The normal value of for QTcb in men is 0.44 seconds or less; in women, it is 0.46 seconds or less. [33]
The ECG axis
The QRS axis represents the major vector of ventricular activation, which is the overall direction of electrical activity. The electrical activity in healthy individuals starts at the sinoatrial node and spreads to the atrioventricular node down the Bundle of His, followed by conduction through the left and right bundle branches,and then to the Purkinje fibers to cause ventricular contraction. A positive deflection is when the direction of the overal electrical activity is toward that lead. Therefore, the cardiac axis may provide the overall direction of electrical activity when the ventricles depolarize. The normal cardiac axis is expected to lie between -30º and 90º, which means the overall direction of electrical activity is toward leads I, II, and III.
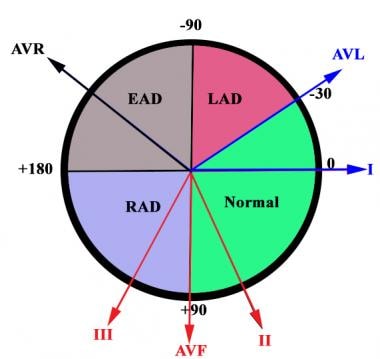 Electrocardiographic axis. Normal axis is between -30º and 90º; left axis deviation (LAD) is between -30º and - 90º; right axis deviation (RAD) is between 90º and 180º; extreme axis deviation (EAD) (left or right) is between -90º and -180º.
The electrical axis can be estimated from the standard frontal leads. There are shortcut methods to determine the axis. For example, if the QRS complex is upright in both leads I and II, then the axis must fall somewhere between -30º and 90º and the axis is normal.
If the complexes are negative in lead I and positive in lead aVF, then the axis is rightward. If the complexes are positive in lead I but negative in lead II, then the axis is leftward. If the complexes are negative in both leads I and aVF, then the axis is extreme.
The causes of left axis deviation include normal variation, left ventricular hypertrophy, left anterior fascicular block, congenital heart disease with primum atrial septal defect or endocardial cushion defect, ventricular ectopic beats, and preexcitation syndromes. [34]
The causes of right axis deviation include normal variation, right ventricular hypertrophy, left posterior fascicular block, ventricular ectopic beats, preexcitation,and dextrocardia. [34]
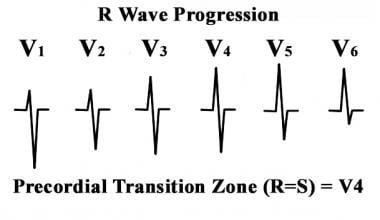
R wave progression
The R wave should progress in size across leads V1 to V6. Normally, in lead V1, there is a small R wave with a deep S wave; the R-wave amplitude should increase in size with the transition zone, normally in leads V2 to V4. Poor or late R-wave progression consists of a transition zone in lead V5 or V6, and it can be a sign of a previous anterior myocardial infarction. [35]
-
I, II and III represent the original three leads used by Einthoven. These describe the electrical vector between the right and left arms, right arm and left leg, and left arm and left leg, respectively. R, L, and F represent the augmented limb leads aVR, aVL, and aVF. They are calculated as follows: aVR = (I+II)/2 , aVL = (I-III)/2, aVF = (II+III)/2.
-
The hexagonal reference system is the standard method of determining the axis of electrical activation of the heart. As an example, depolarization that is parallel with lead II would yield a value of 60º, whereas a depolarization vector in the opposite direction would be -120º. Image courtesy of Wikipedia.
-
Proper placement of the precordial leads for standard 12-lead electrocardiography.
-
The hexagonal reference system is the standard method of determining the axis of electrical activation of the heart. As an example, depolarization parallel with lead II would yield a value of 60º, whereas a depolarization vector in the opposite direction would be -120º.
-
Electrocardiogram waves, intervals, and segments.
-
On standard calibration, each large box has sides of 0.5 cm. On the horizontal axis, each large box represents 0.2 seconds, and each smaller box represents 0.04 seconds. On the vertical axis, each small box is 1 mm in height; 10 mm = 1 mV.
-
Heart rates associated with each of the large boxes in the following order are 300, 150, 100, 75, 60, 50, 43, 37, 33 beats per minute (bpm).
-
Heart rate boxes.
-
ST depression.
-
ST elevation.
-
ST morphology.
-
Electrocardiographic axis. Normal axis is between -30º and 90º; left axis deviation (LAD) is between -30º and - 90º; right axis deviation (RAD) is between 90º and 180º; extreme axis deviation (EAD) (left or right) is between -90º and -180º.
-
R-wave progression.
-
A 12-lead electrocardiogram is divided into the following four main contiguous lead groups: inferior, lateral, septal, and anterior.
-
Typical normal 12-Lead electrocardiogram. Courtesy of Dr Bob McGraw, Queen’s University Technical Skills Program and Department of Emergency Medicine (https://meds.queensu.ca/central/assets/modules/ECG/index.html).
